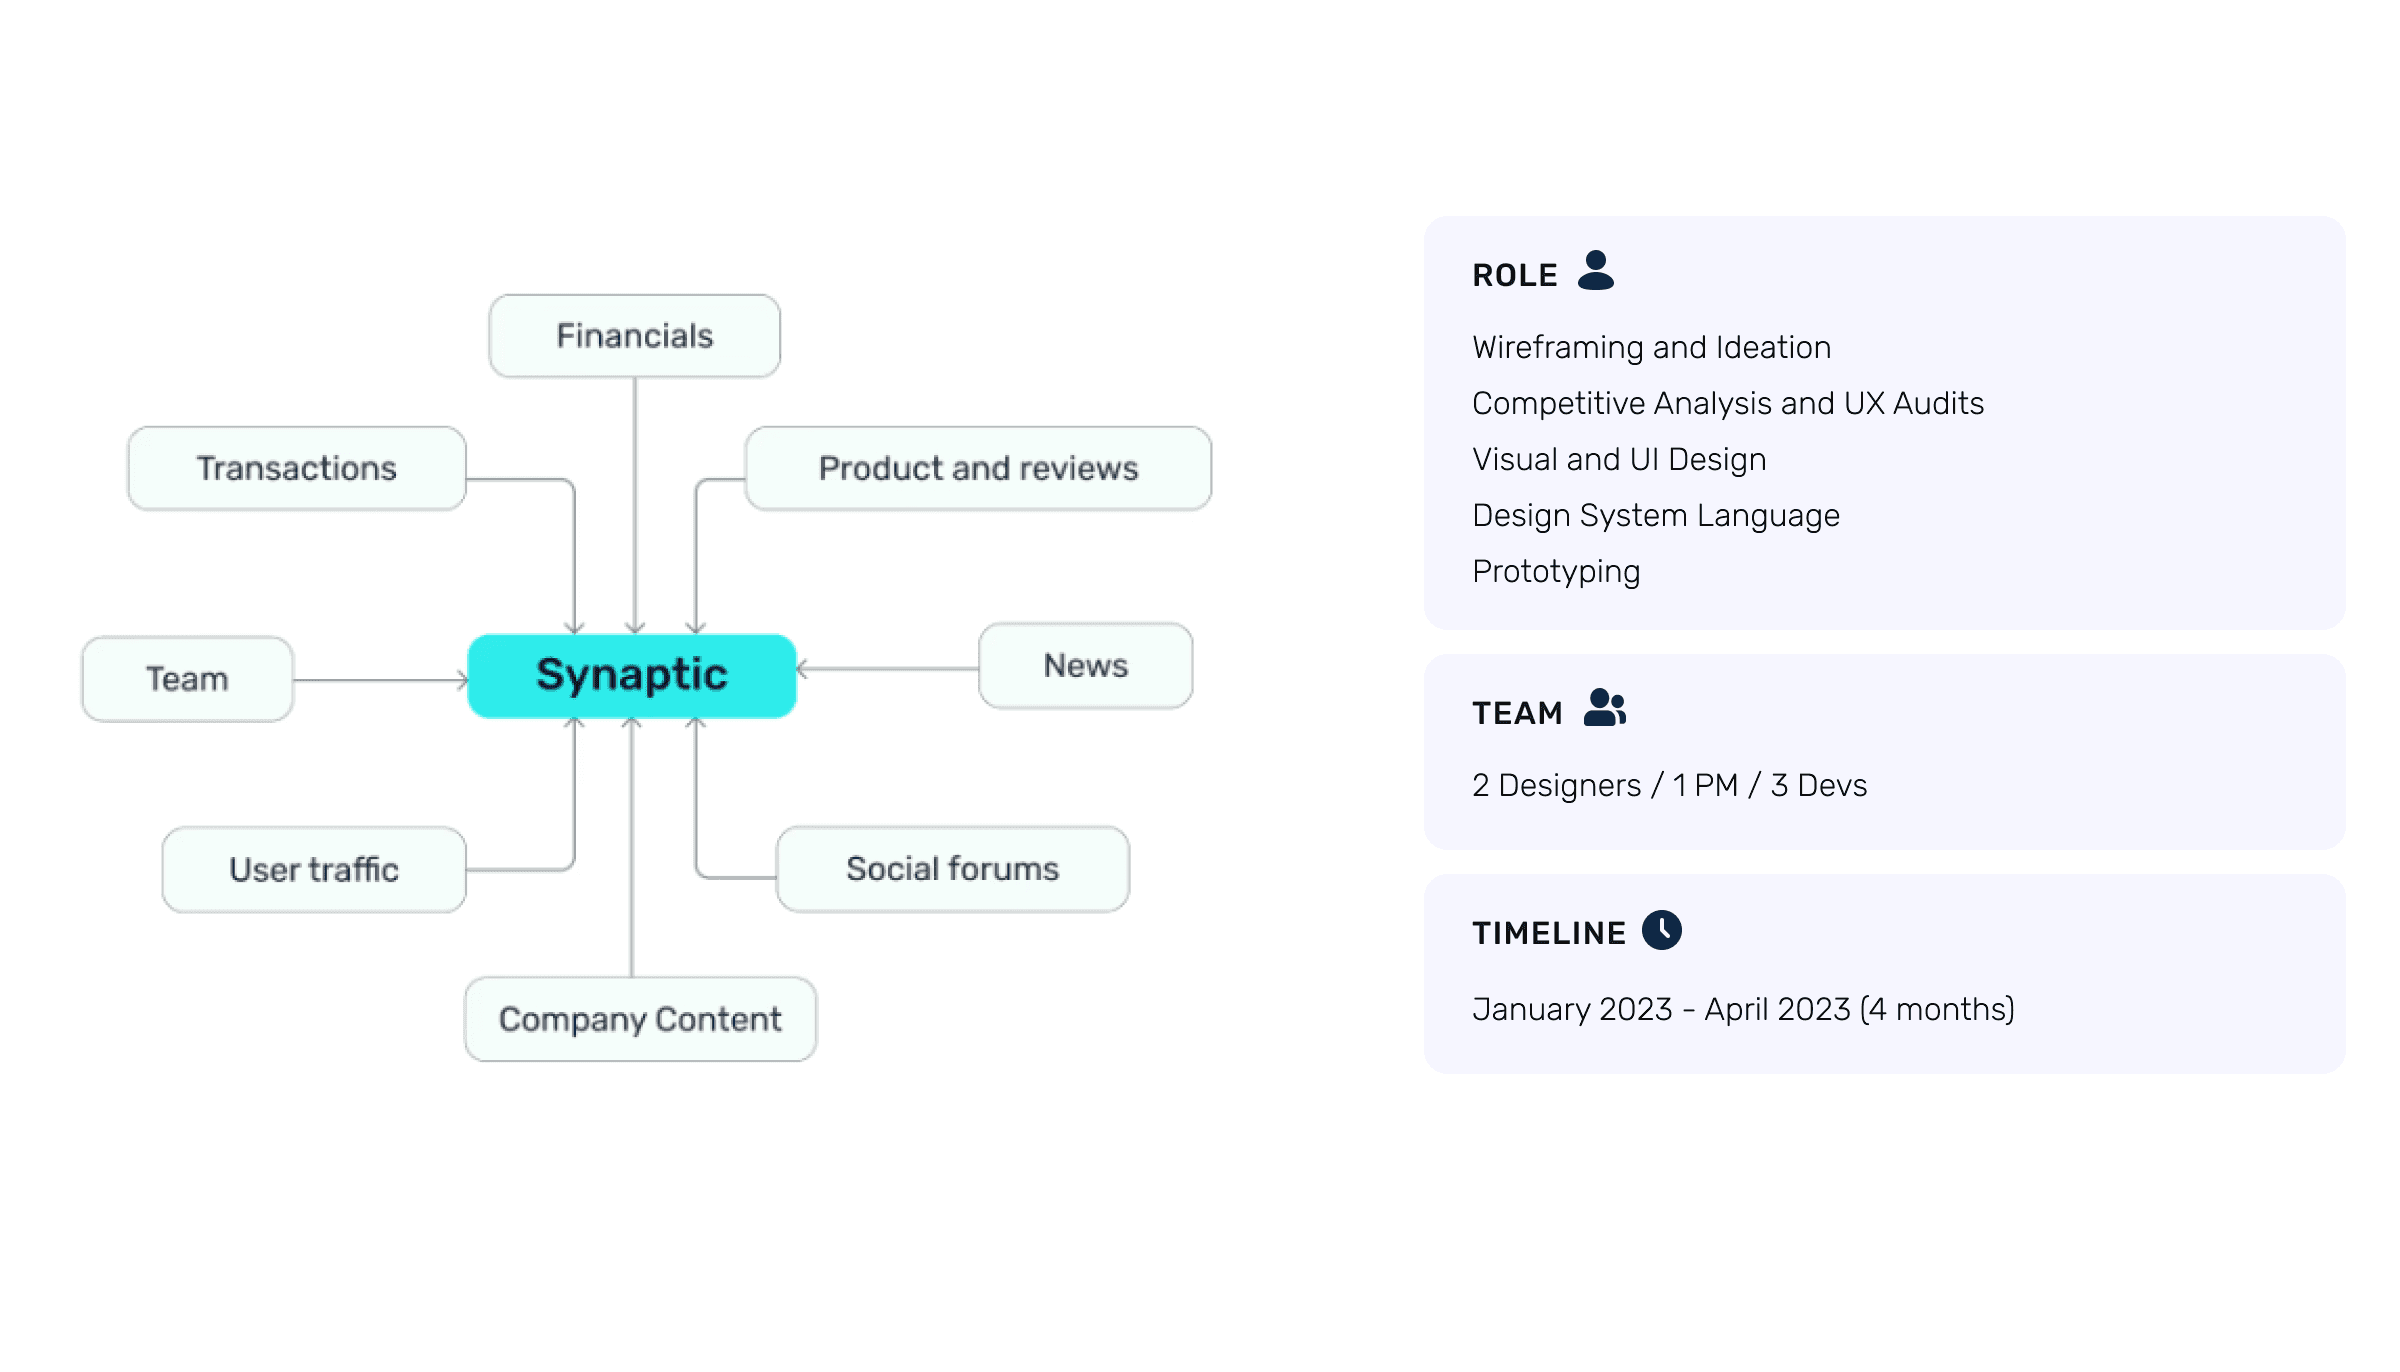
About Synaptic and My Role
Synaptic provides alternative data (sentiment, user traffic etc.) of companies to Venture Capital (VC Firms). Analysts at VC firms filter through this data to find companies to invest in.
User Problem
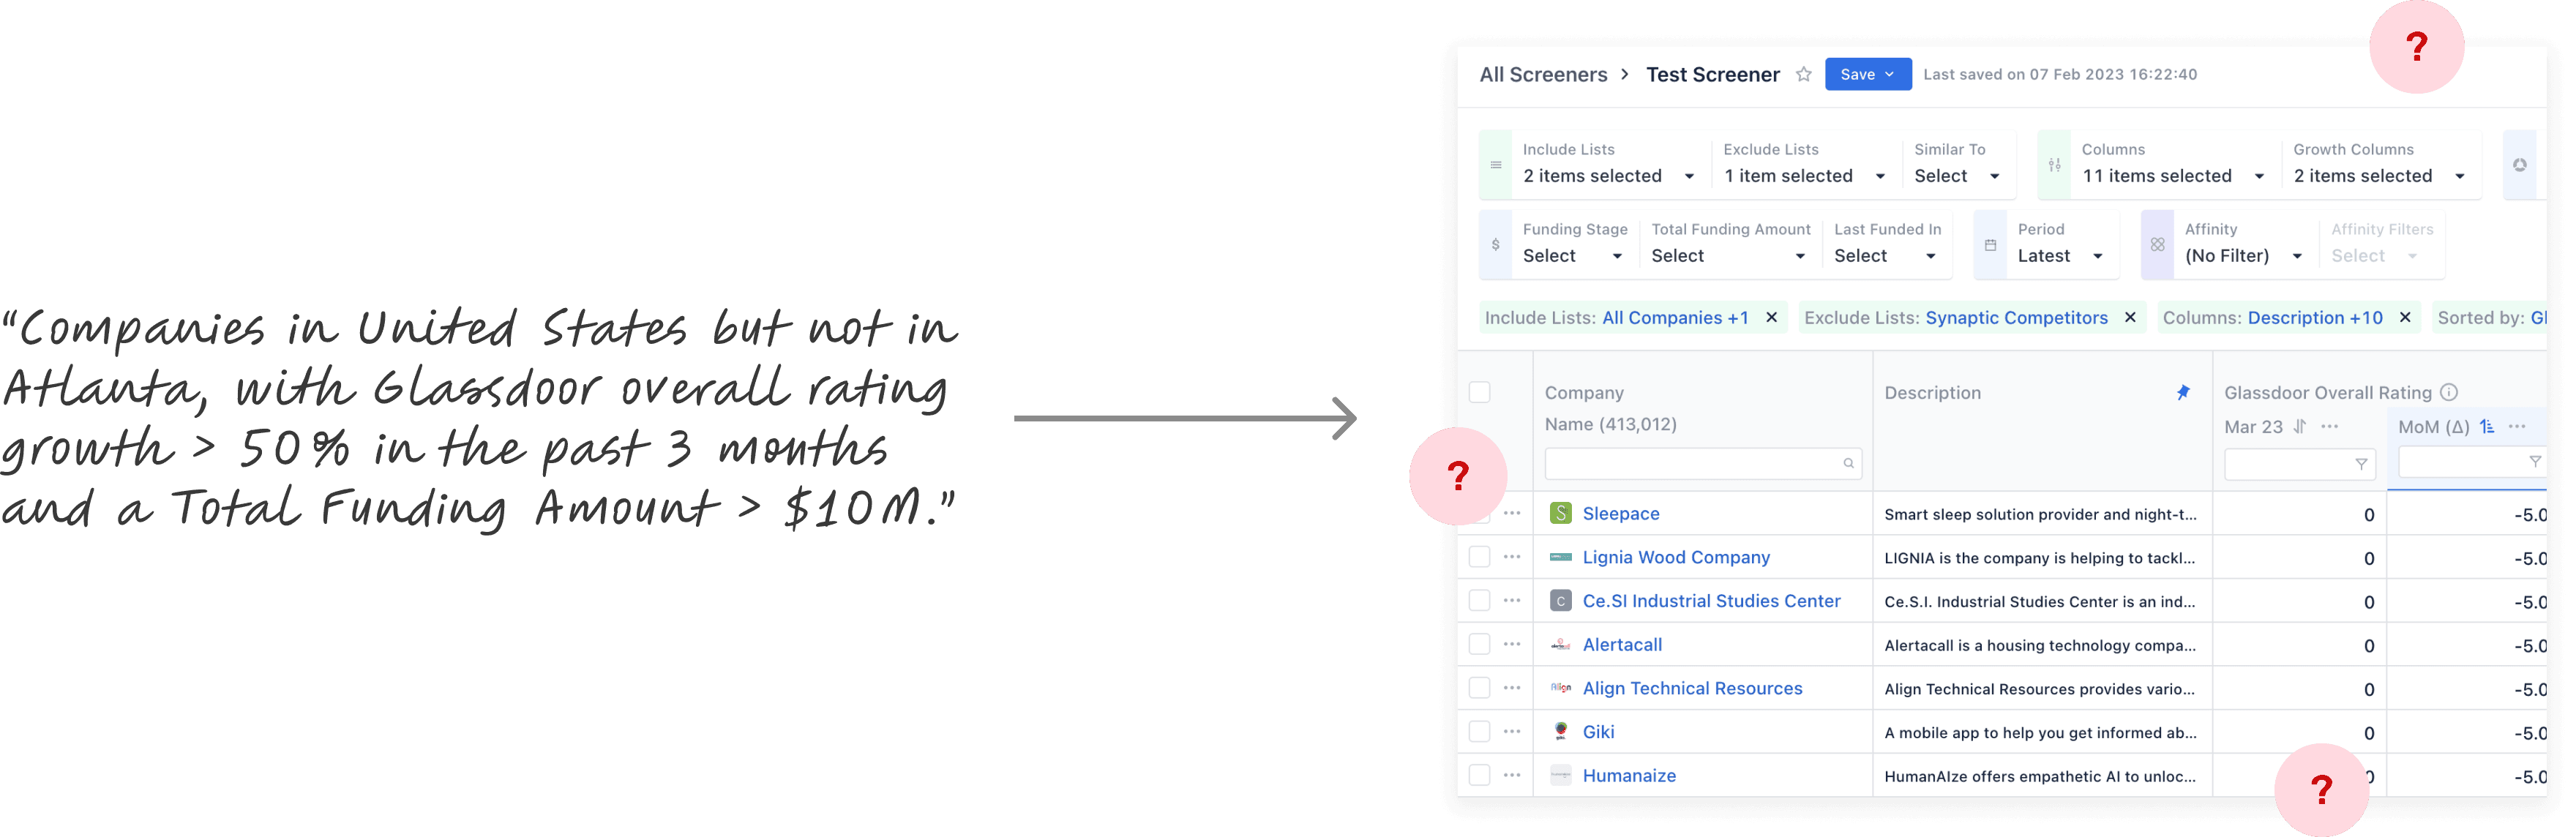
Analysts at venture capital firms want to find companies to fund using complex criteria and fastly, however due to the current filtering limitations on Synaptic's web platform - this task was extremely time consuming.
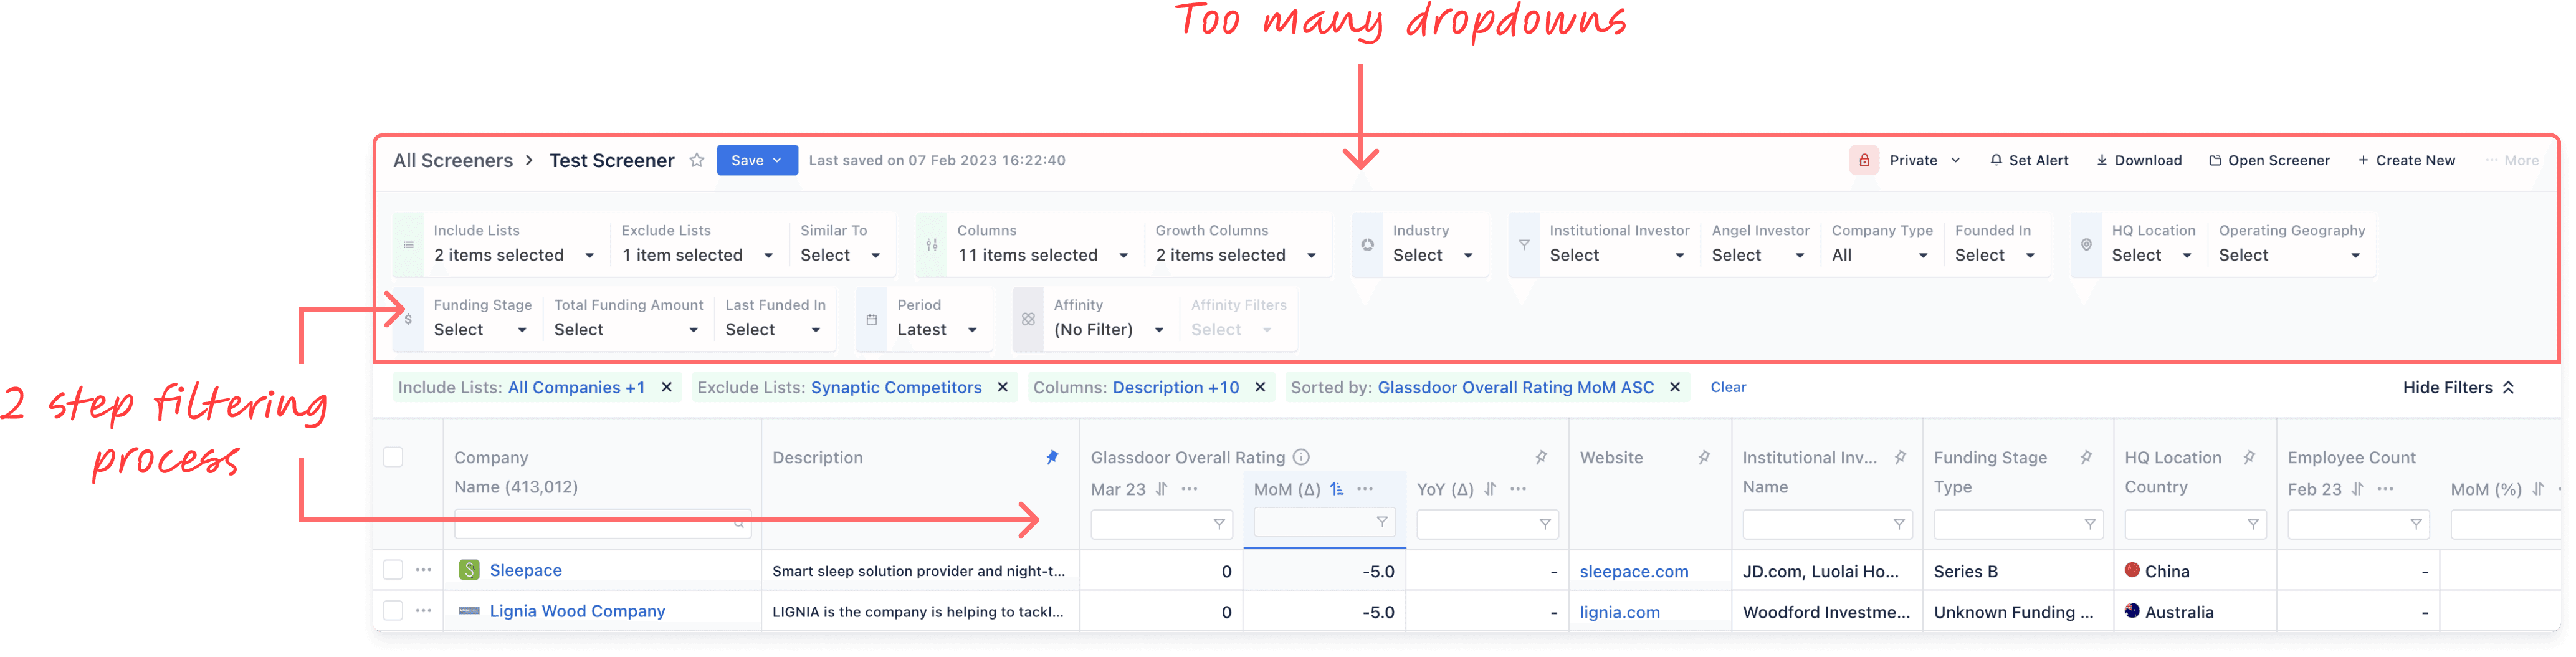
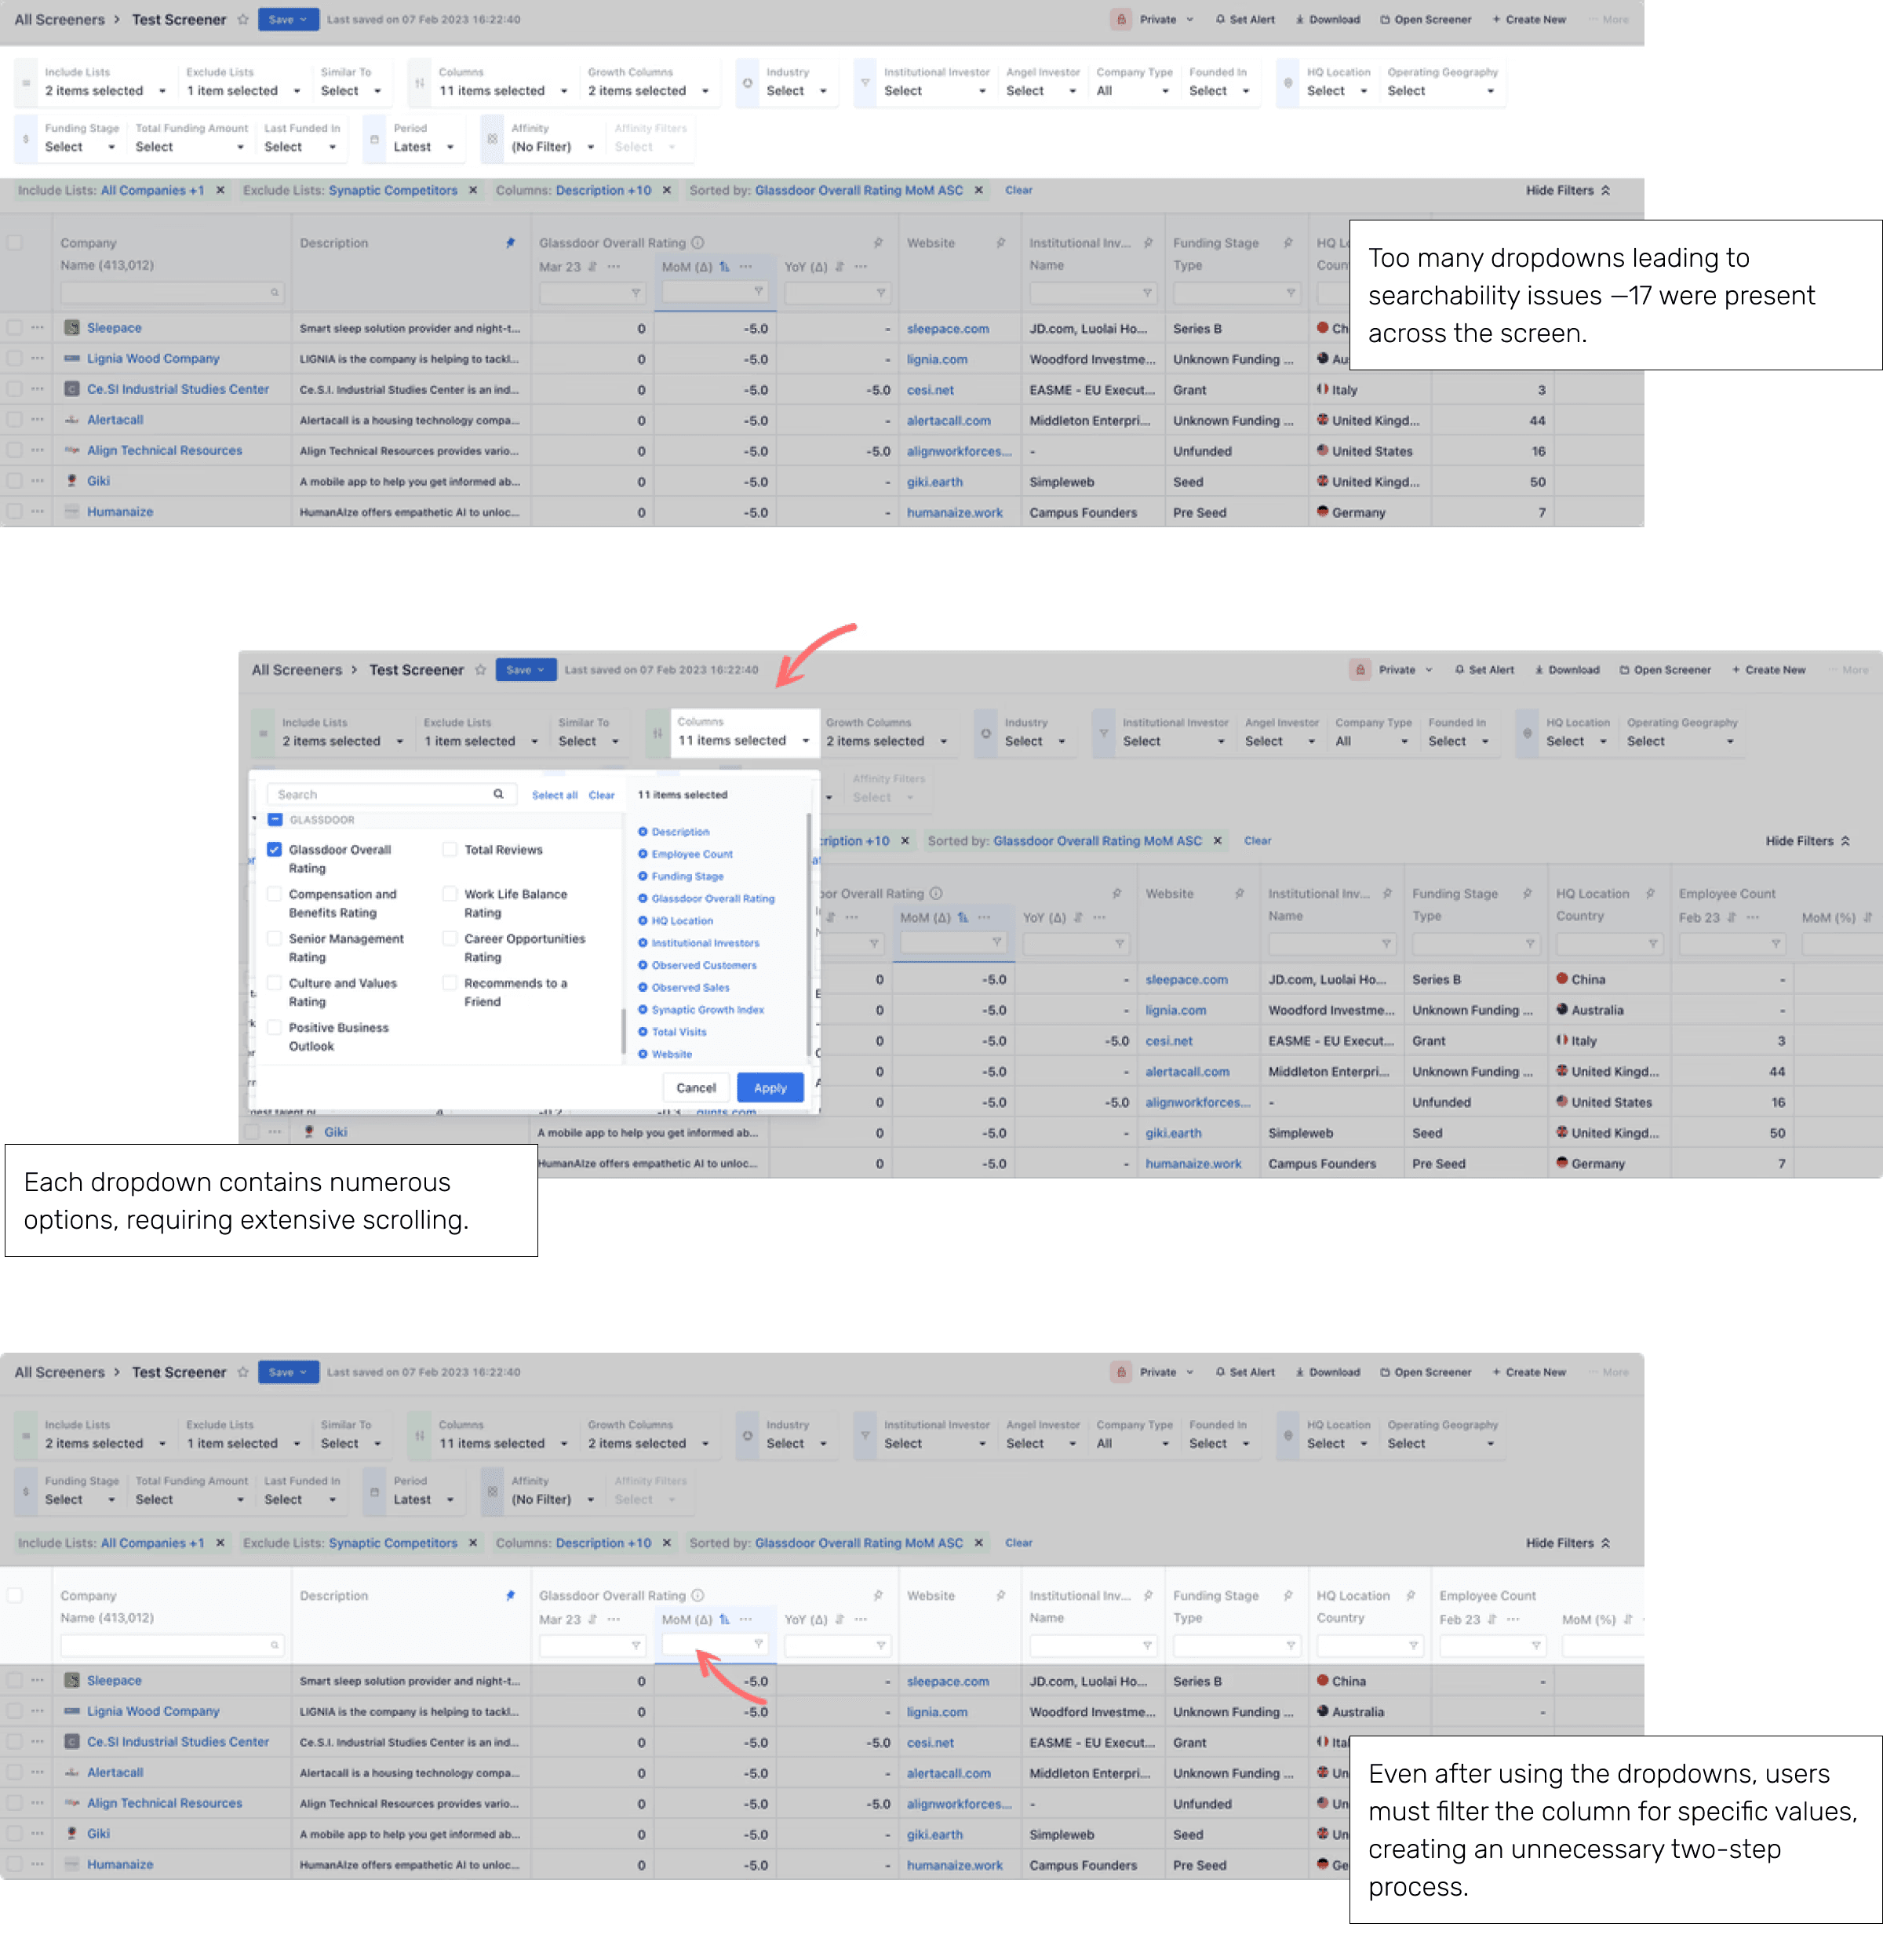
Screener Before
Fixing this was important because it reduced usage of Synaptics' main product — users were turning towards other alternatives/workarounds.

SOLUTION
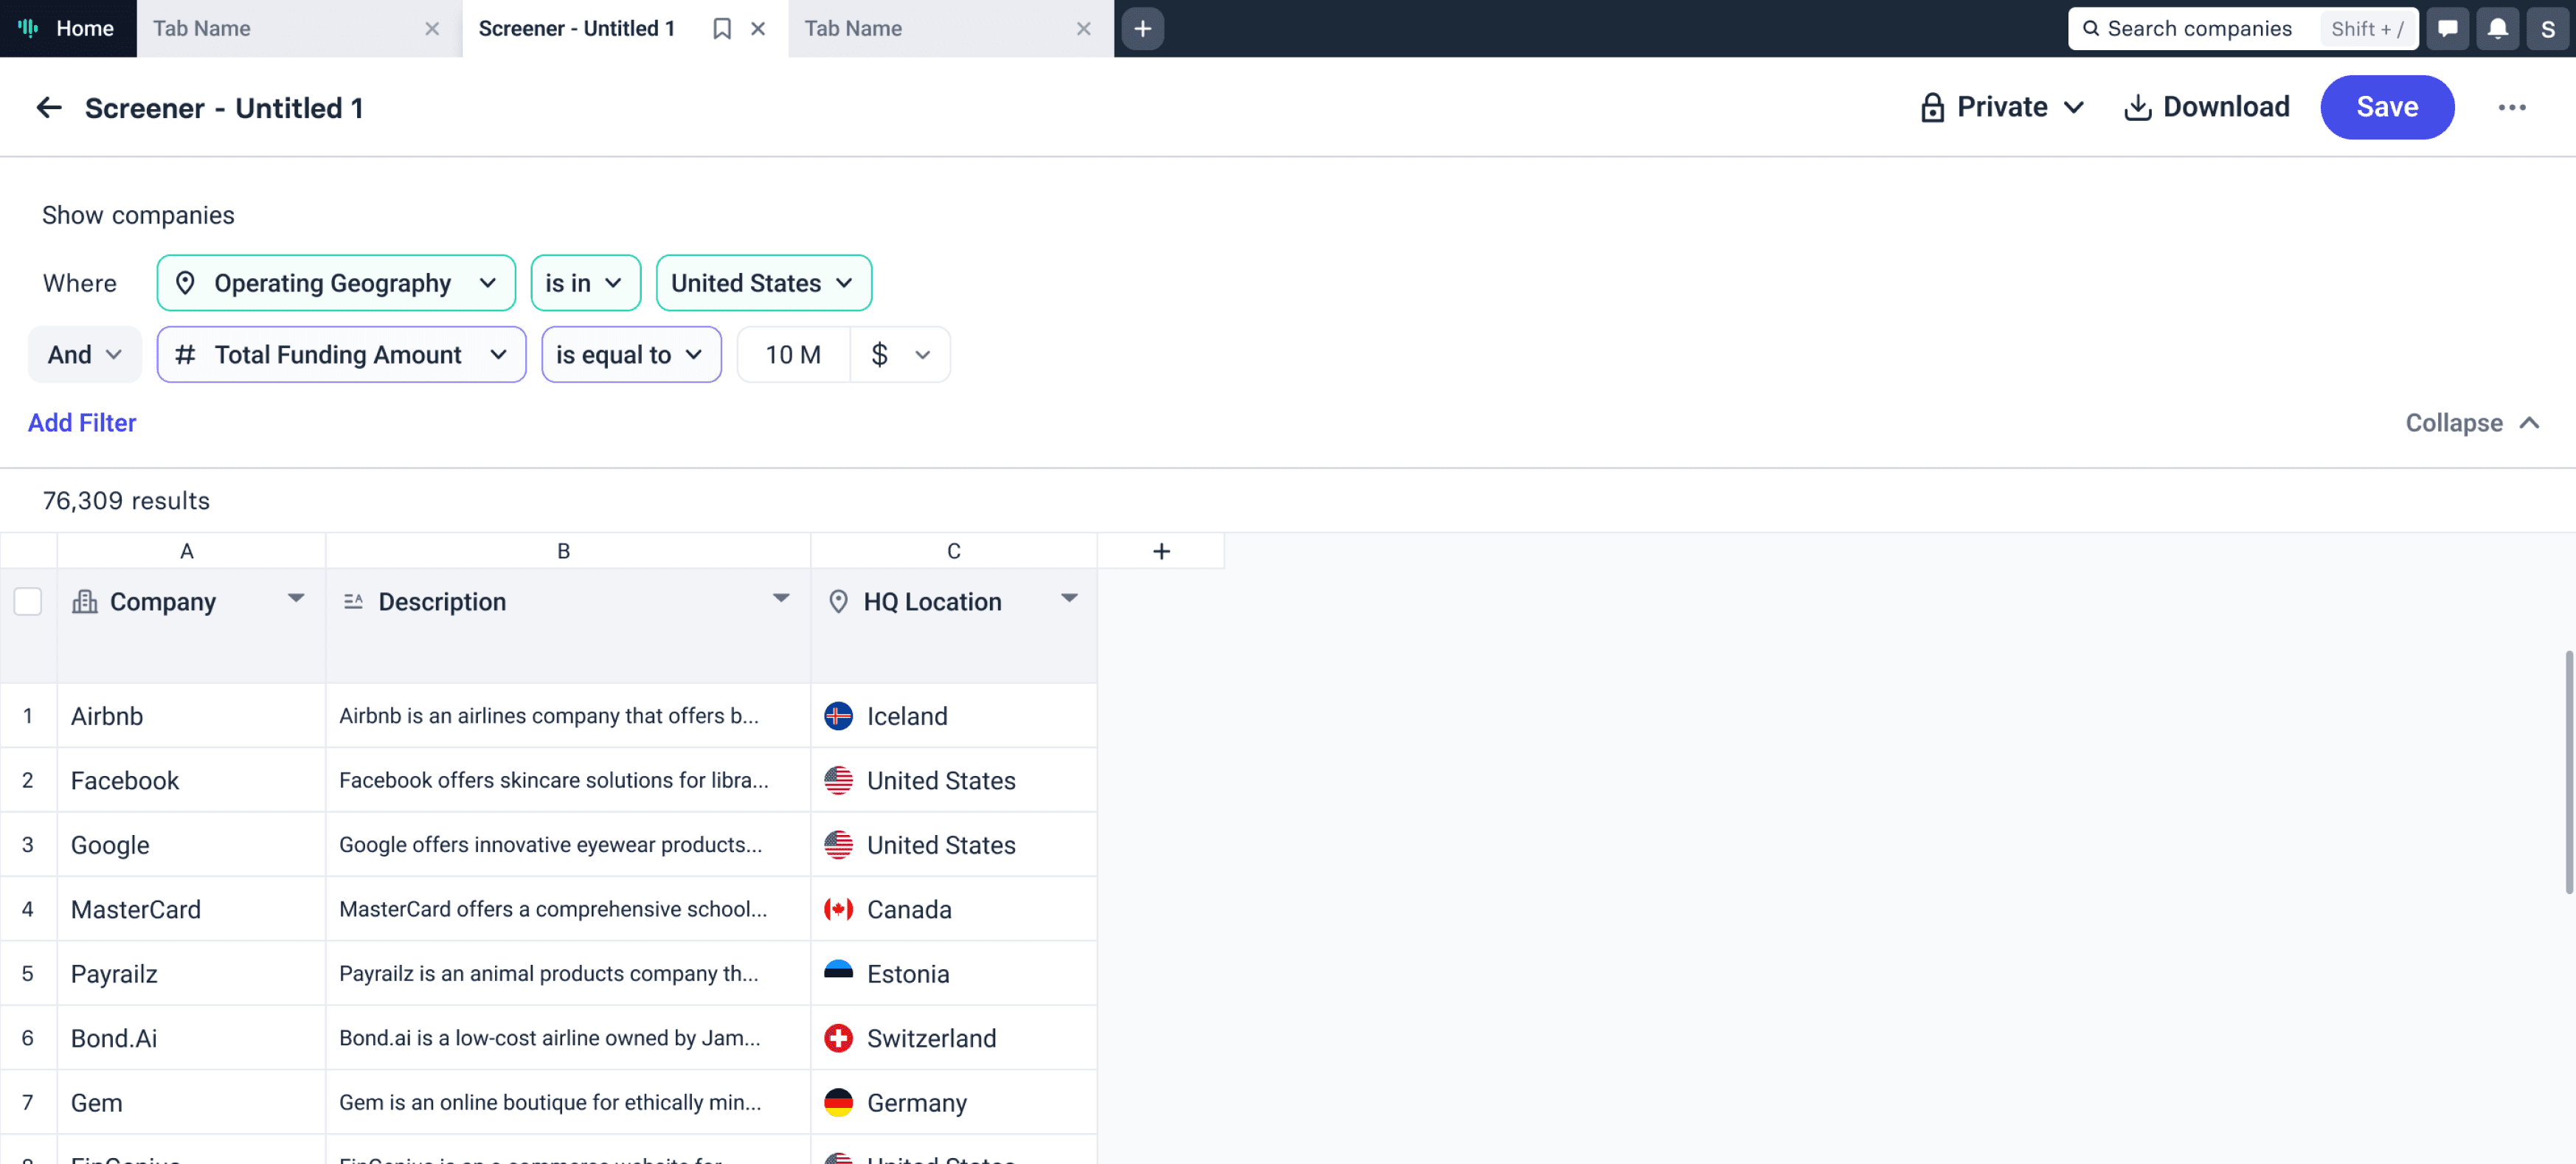
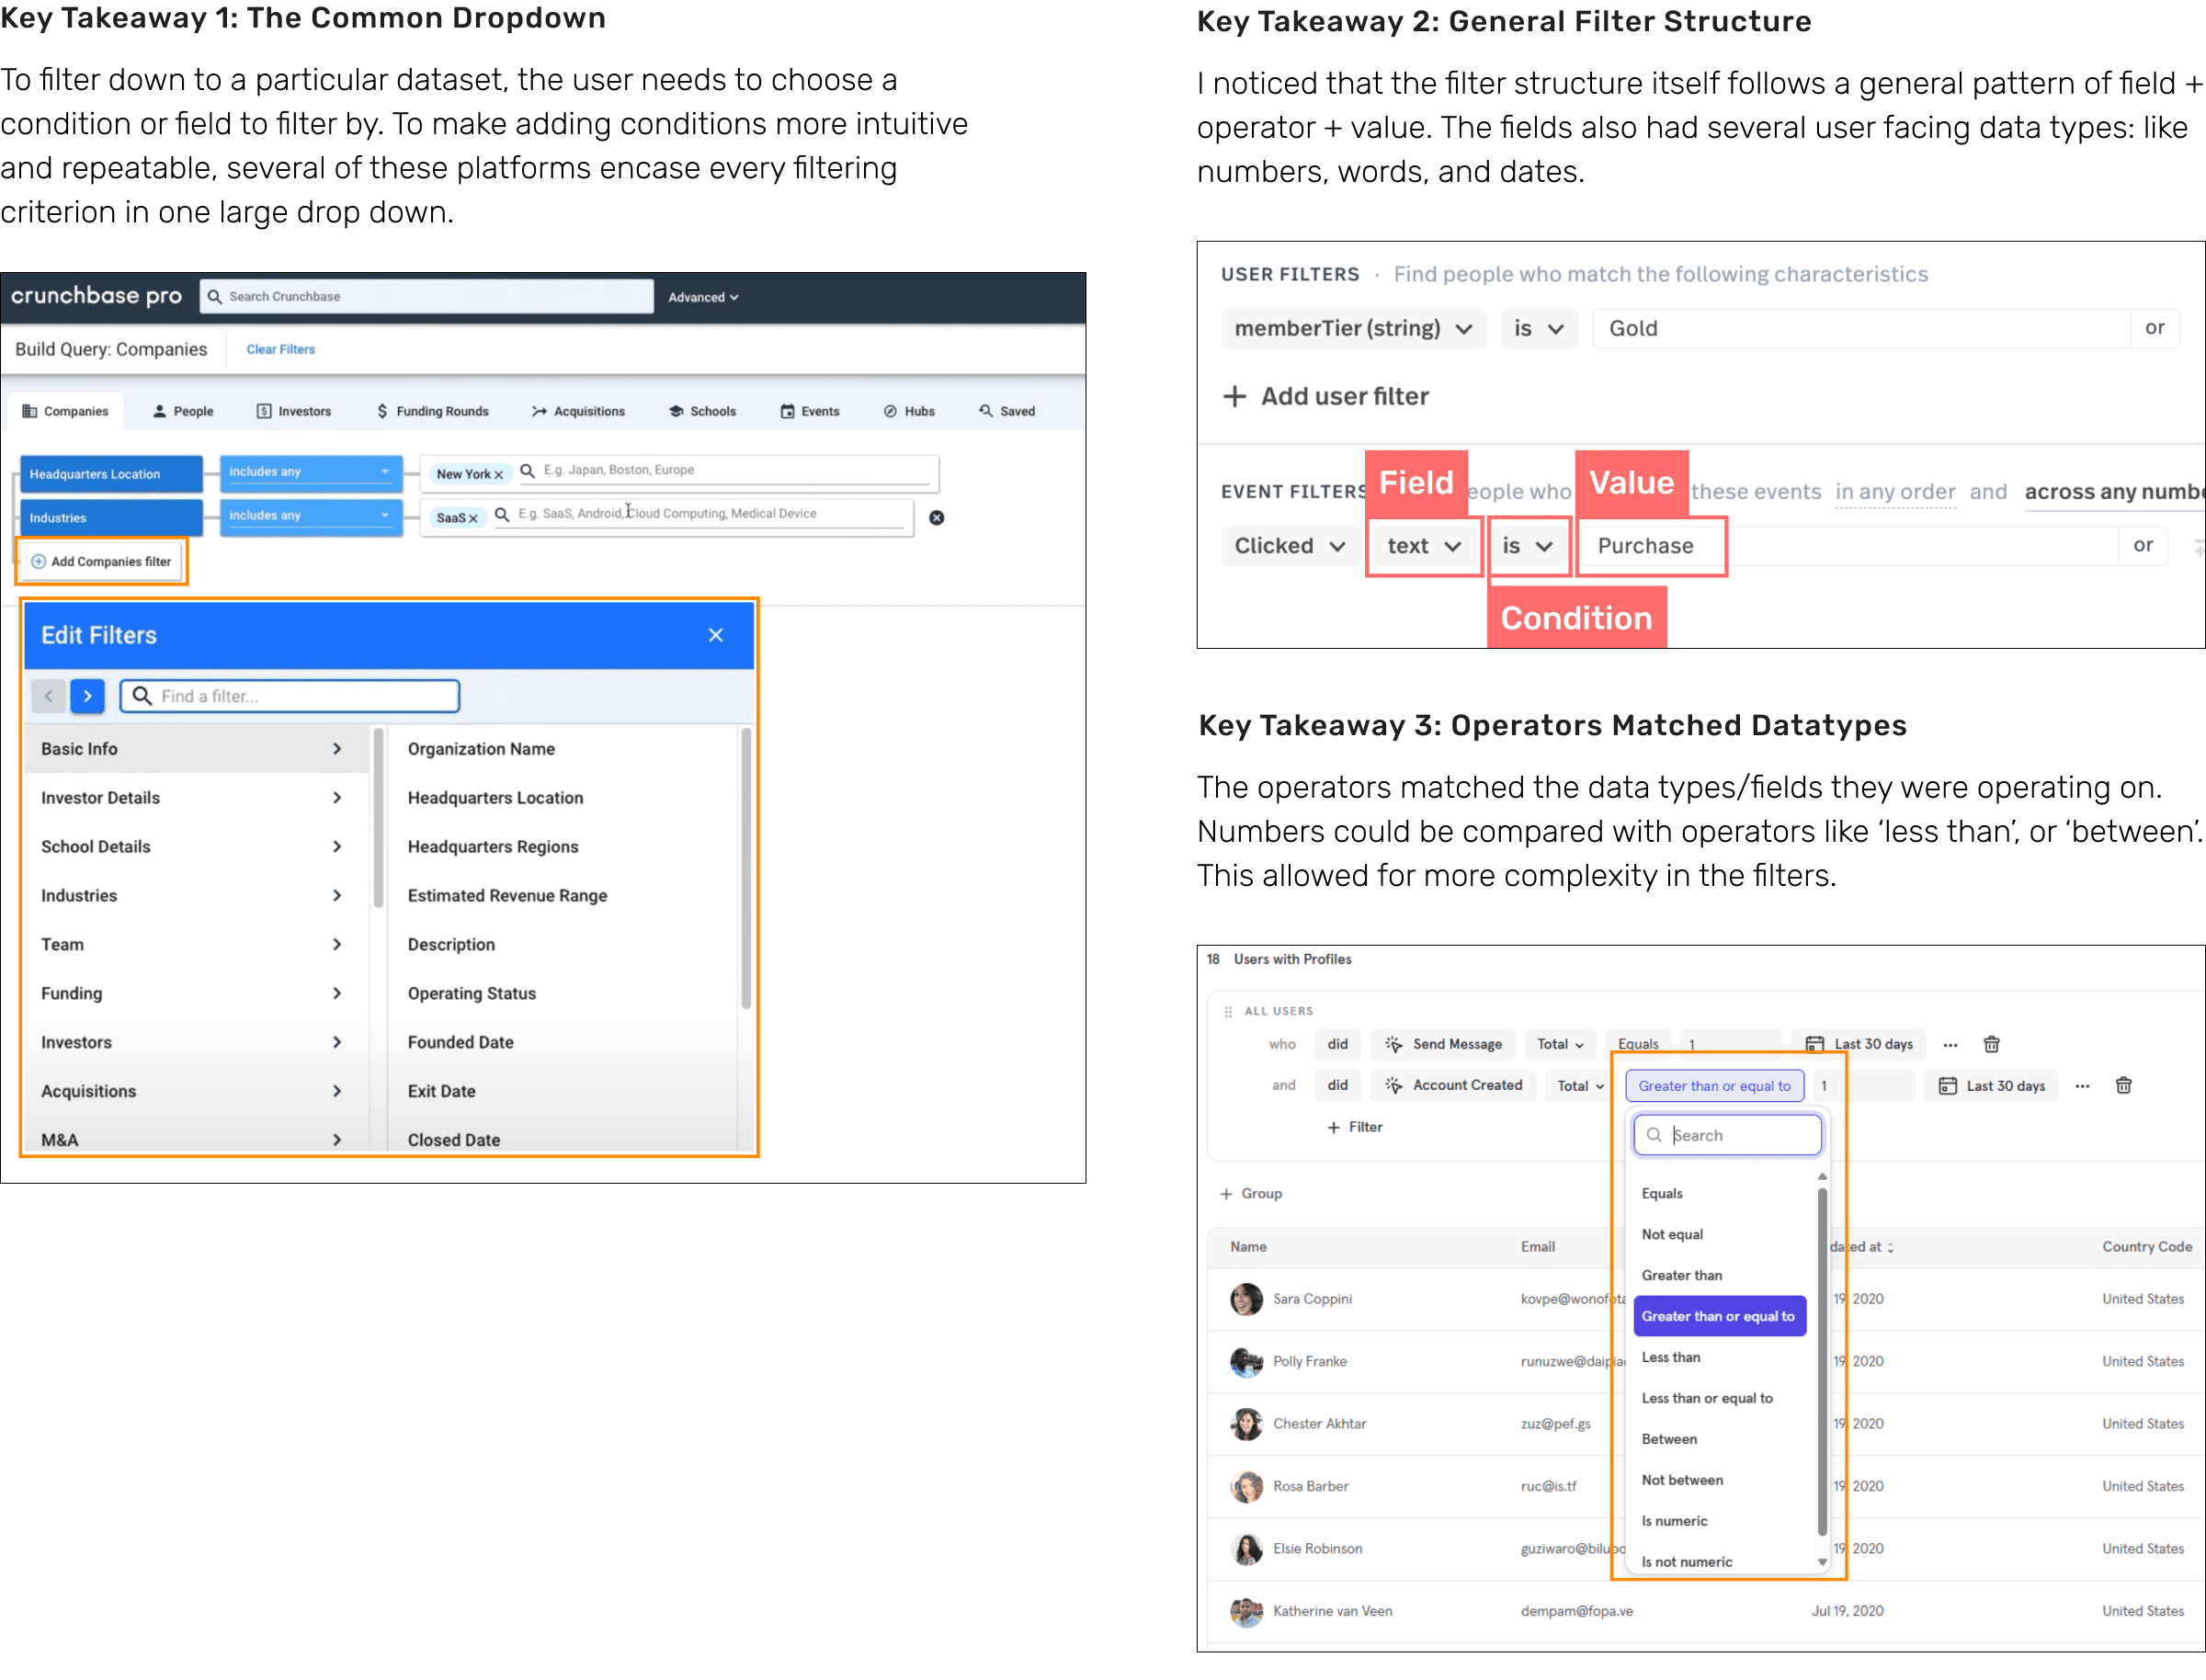
A single-line filter with a common dropdown boosts user task completion.
Advanced conditions like "is in" offer greater flexibility.
IMPACT

HERE'S HOW WE GOT THERE
INFORMATION GATHERING
My primary methods of research were Competitive Analysis and a Cognitive Walkthrough. I was also proactive in asking questions to our founders, designers and product managers, as they hand accumulated subject matter over time, and had previous interactions with users.
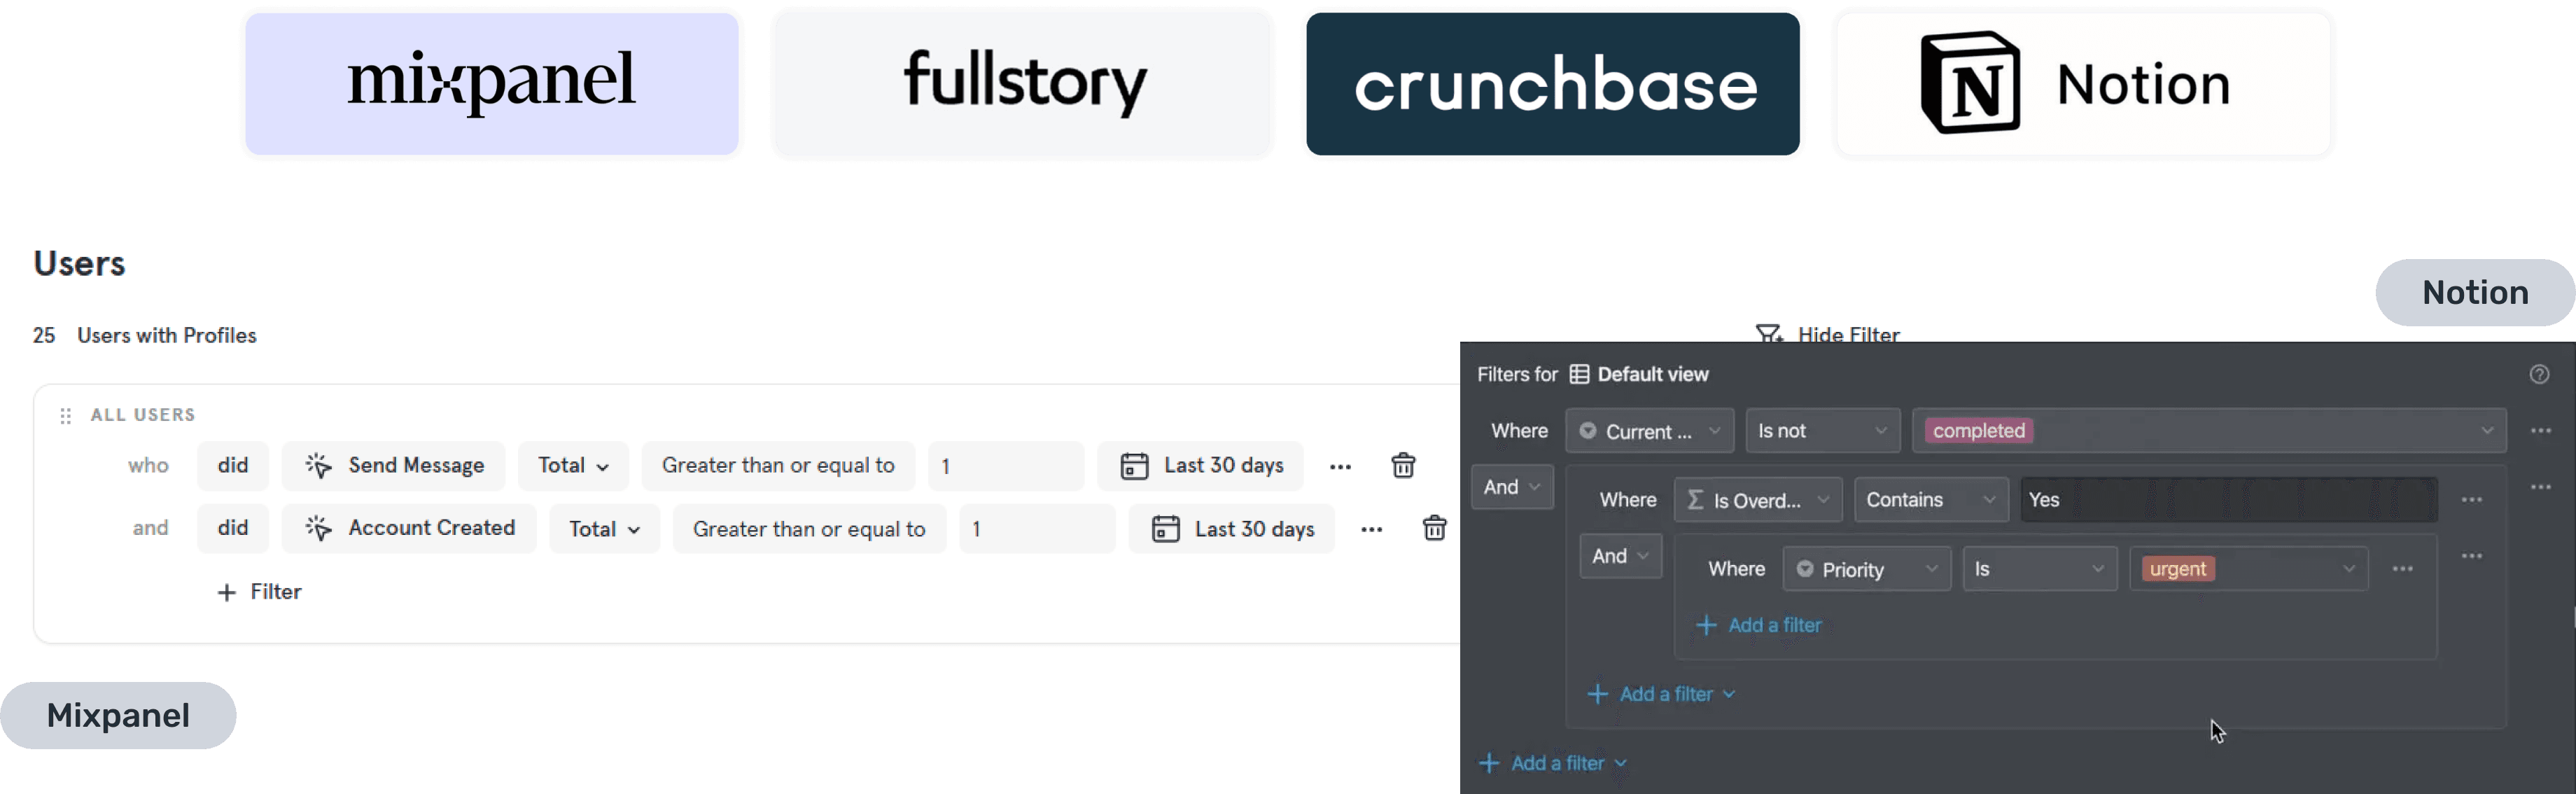
01 Competitive Analysis
I analyzed products such as Mixpanel, Fullstory, Crunchbase and Notion. These products involve large databases similar to Synaptic and do not use simple dropdowns to filter through their data.
02 Cognitive Walkthroughs
Consulted with cofounders and the head of design to compile a list of criteria based on their deep understanding of analyst needs. Our team then conducted cognitive walkthroughs to uncover UX challenges.
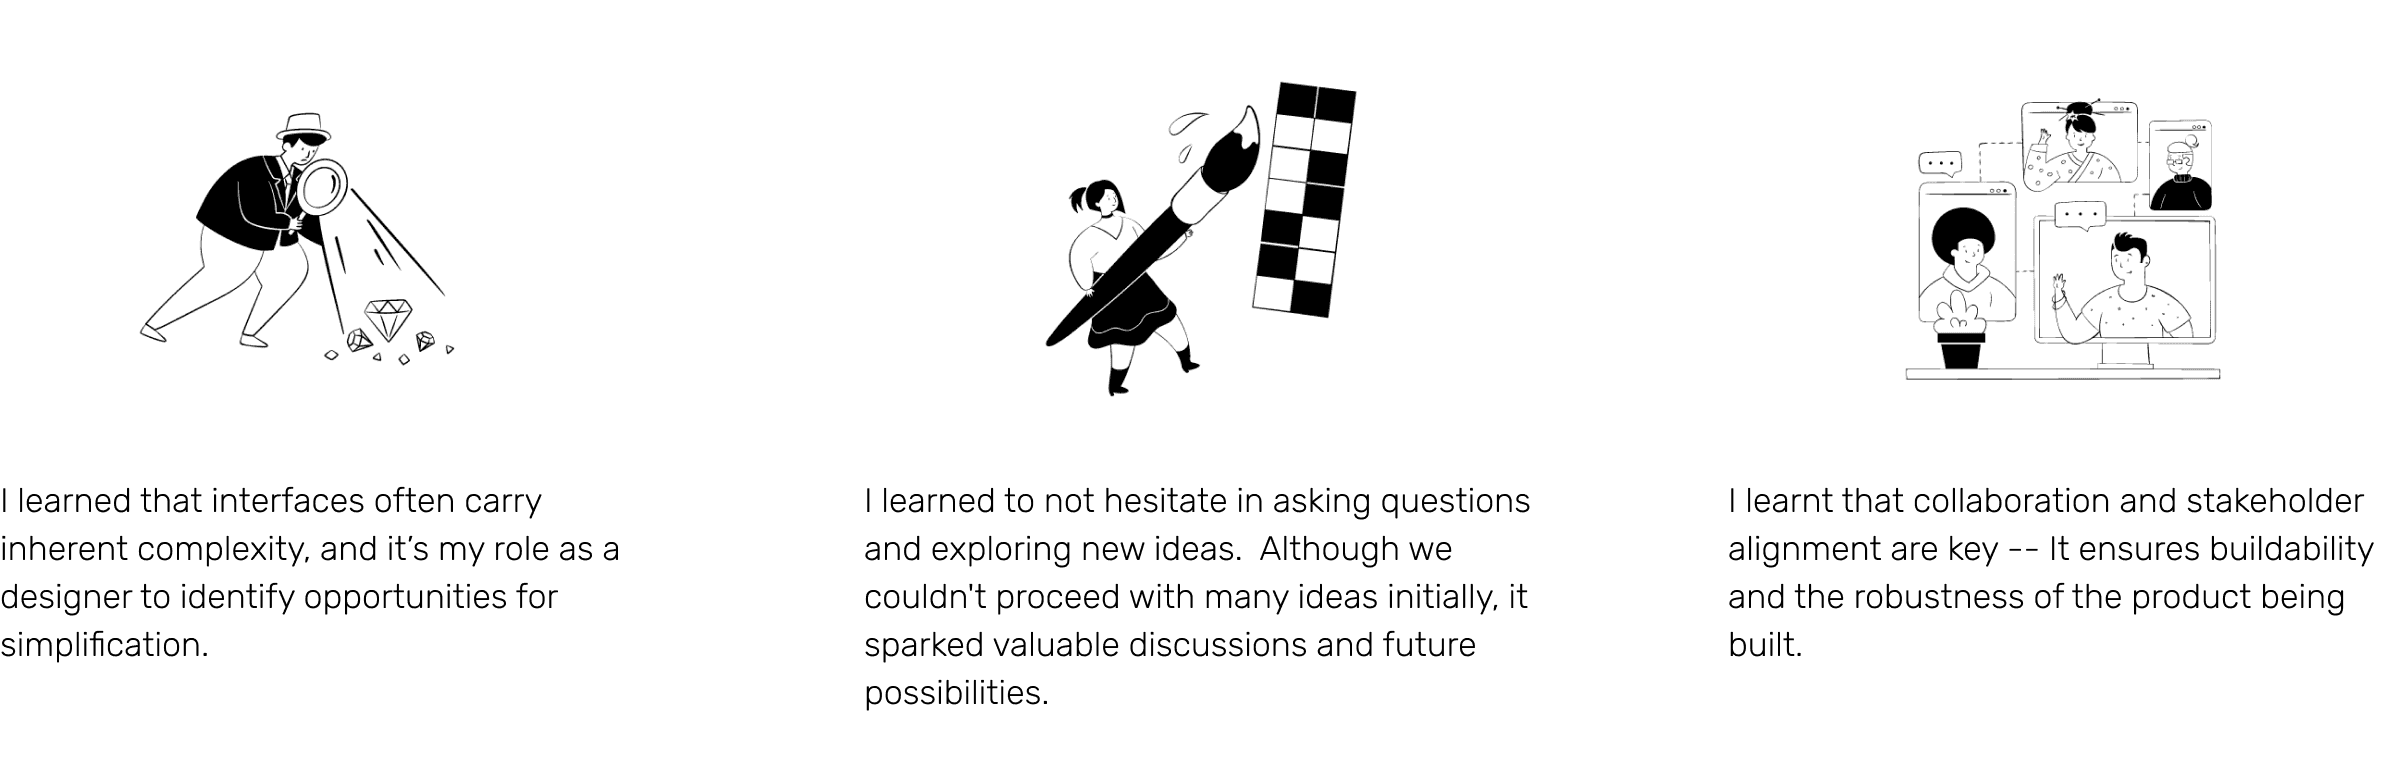
Key Takeaways
DESIGN
Ideation
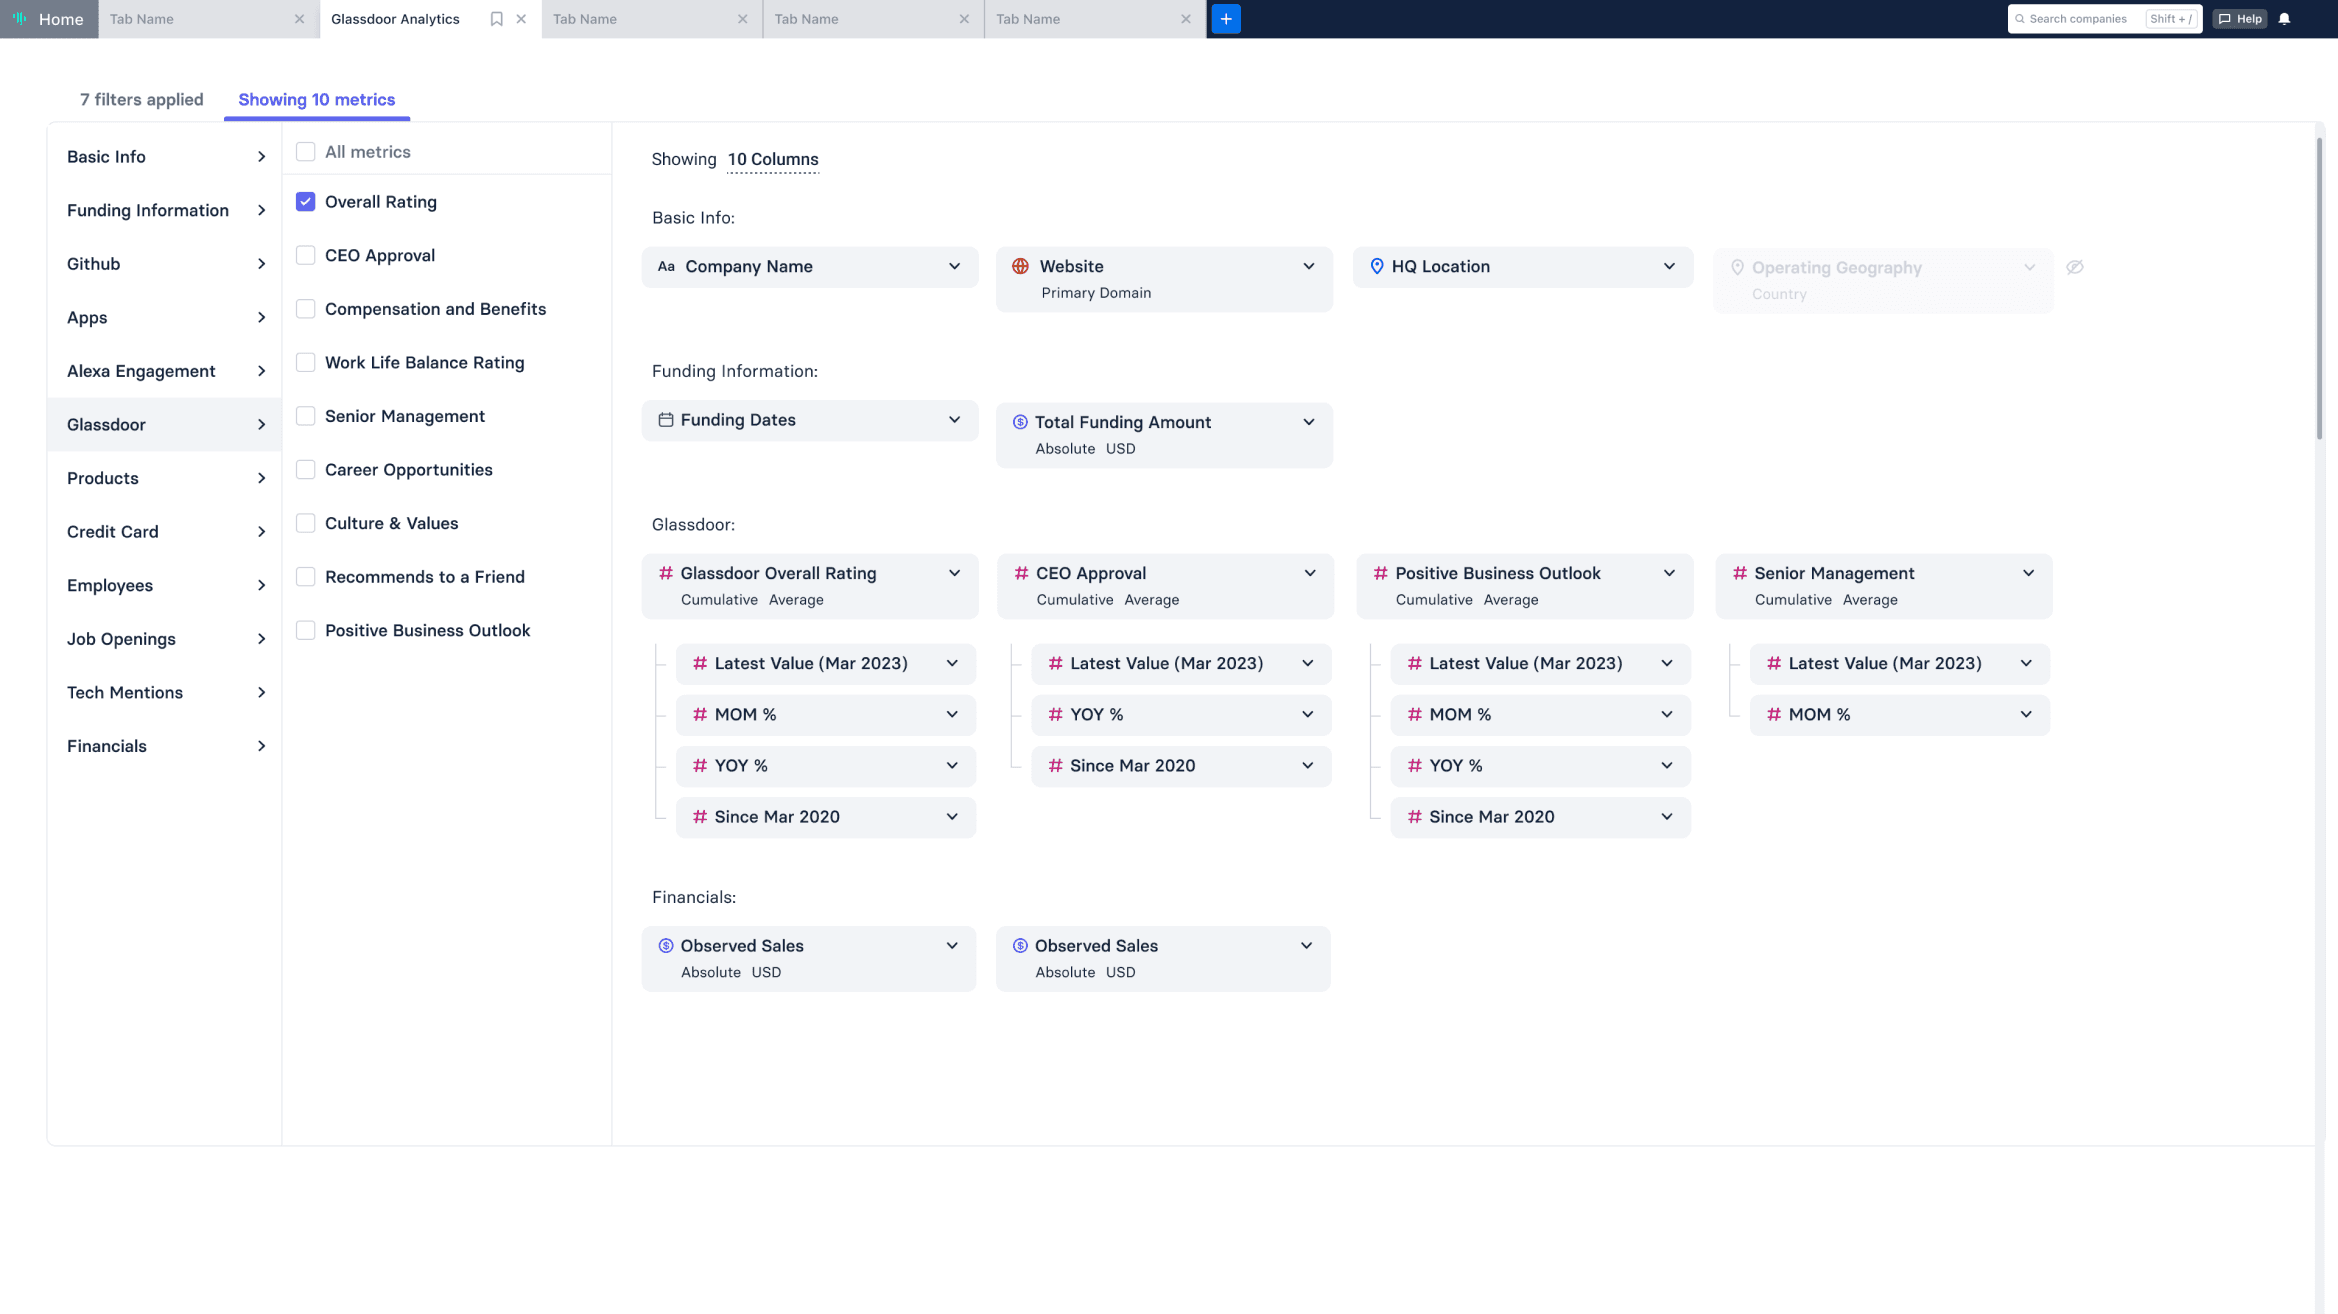
Filters on a separate tab
Explored expanding all the filters into a separate tab. Pros - shows all information at one. Cons - does not relate back to the data table, does not solve searchability difficulties.
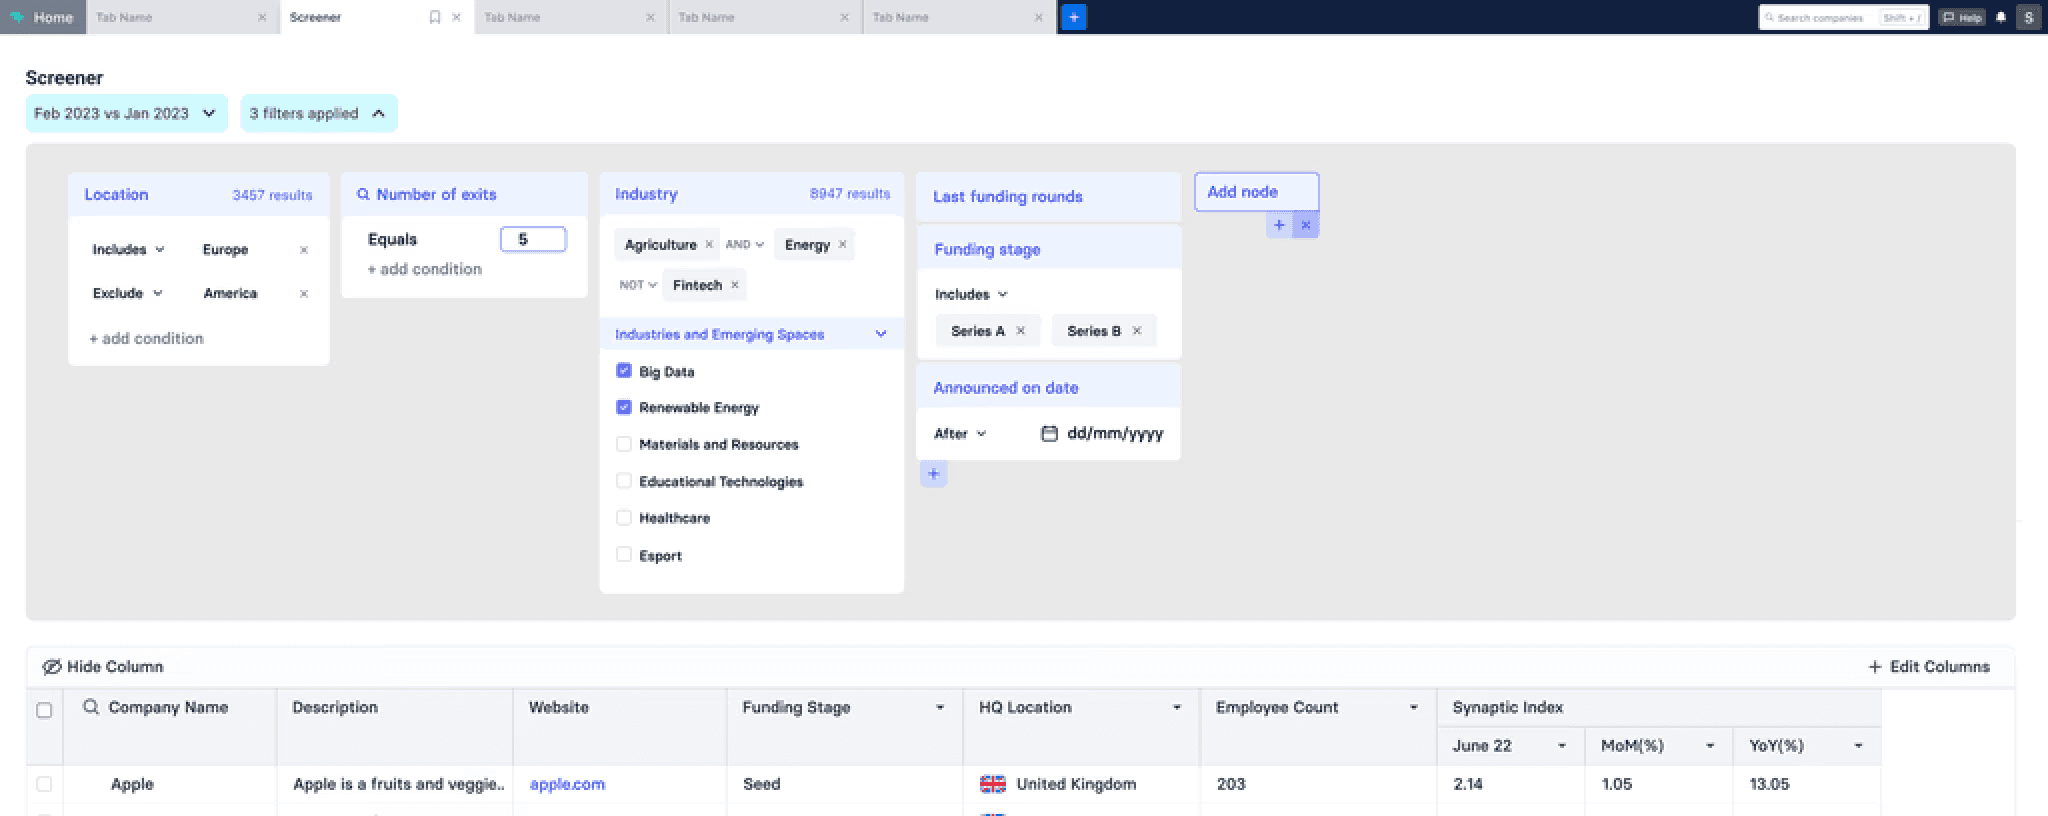
Grouped Filters Map
Each node acts as a filter, expanding horizontally to add more criteria and filtering by value vertically. Cons - its a new idea and has not been tested.
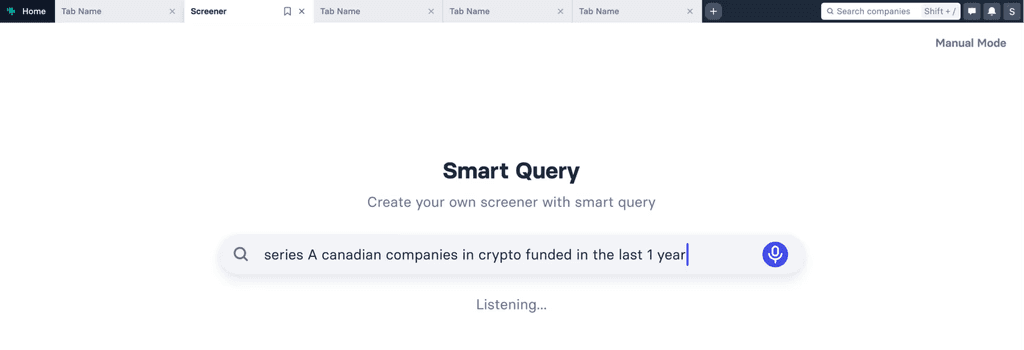
Smart Query
Asking questions in natural language instead of filters.
Taking the Proven Path
Out of the many we opted for horizontal filters, a proven design in similar products, ensuring both user needs and near-term buildability. Here are the initial iterations of the horizontal filters. We used a brute force approach to mock up how the filters might align with analysts' company data needs.
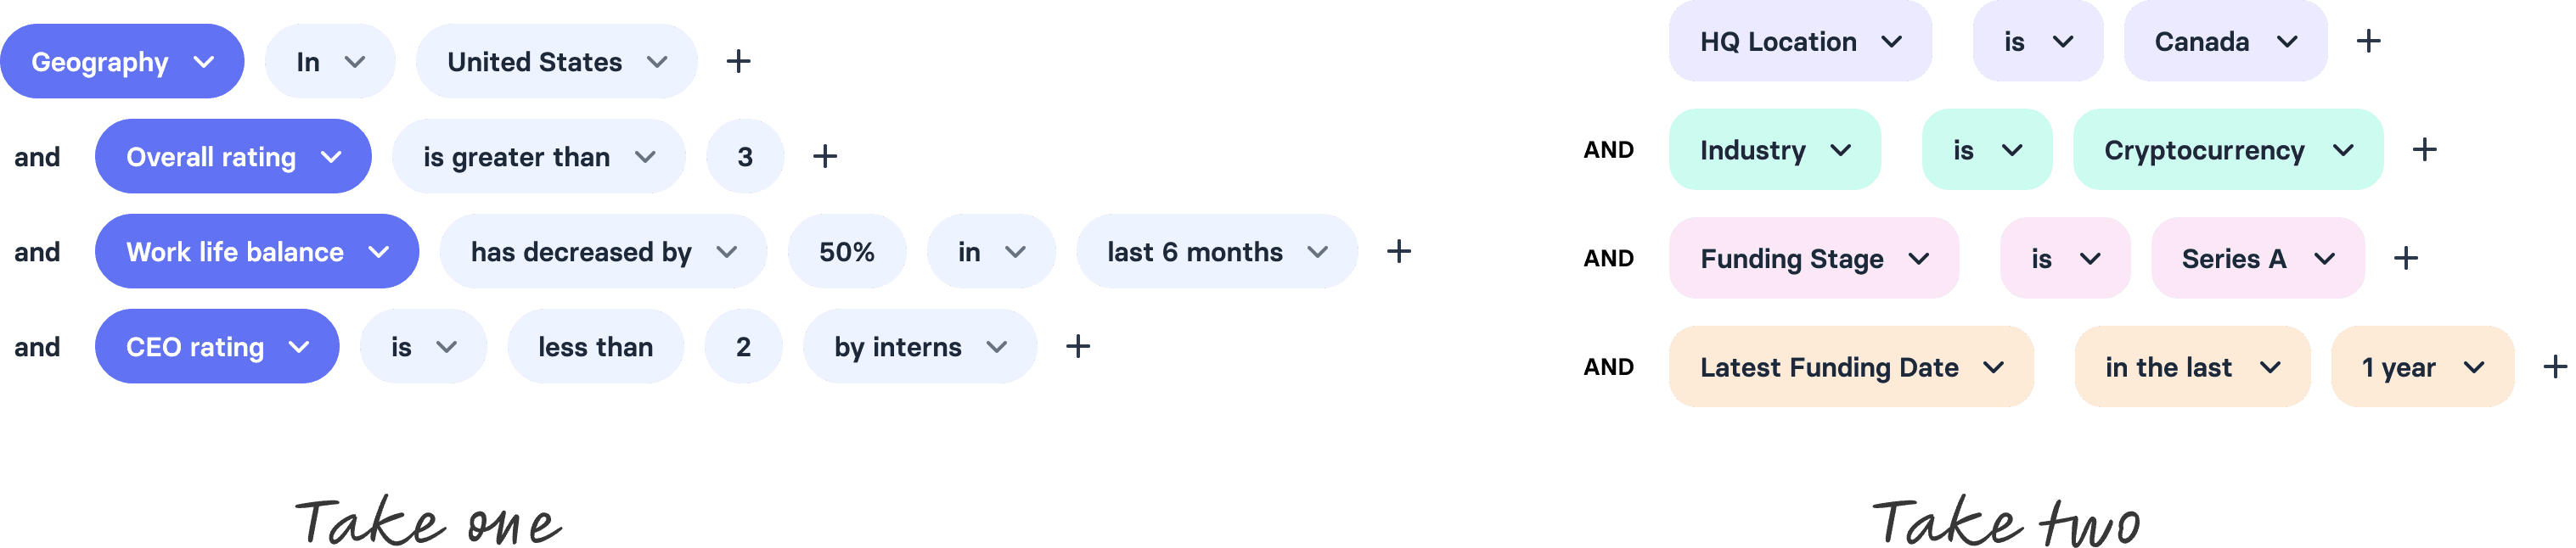
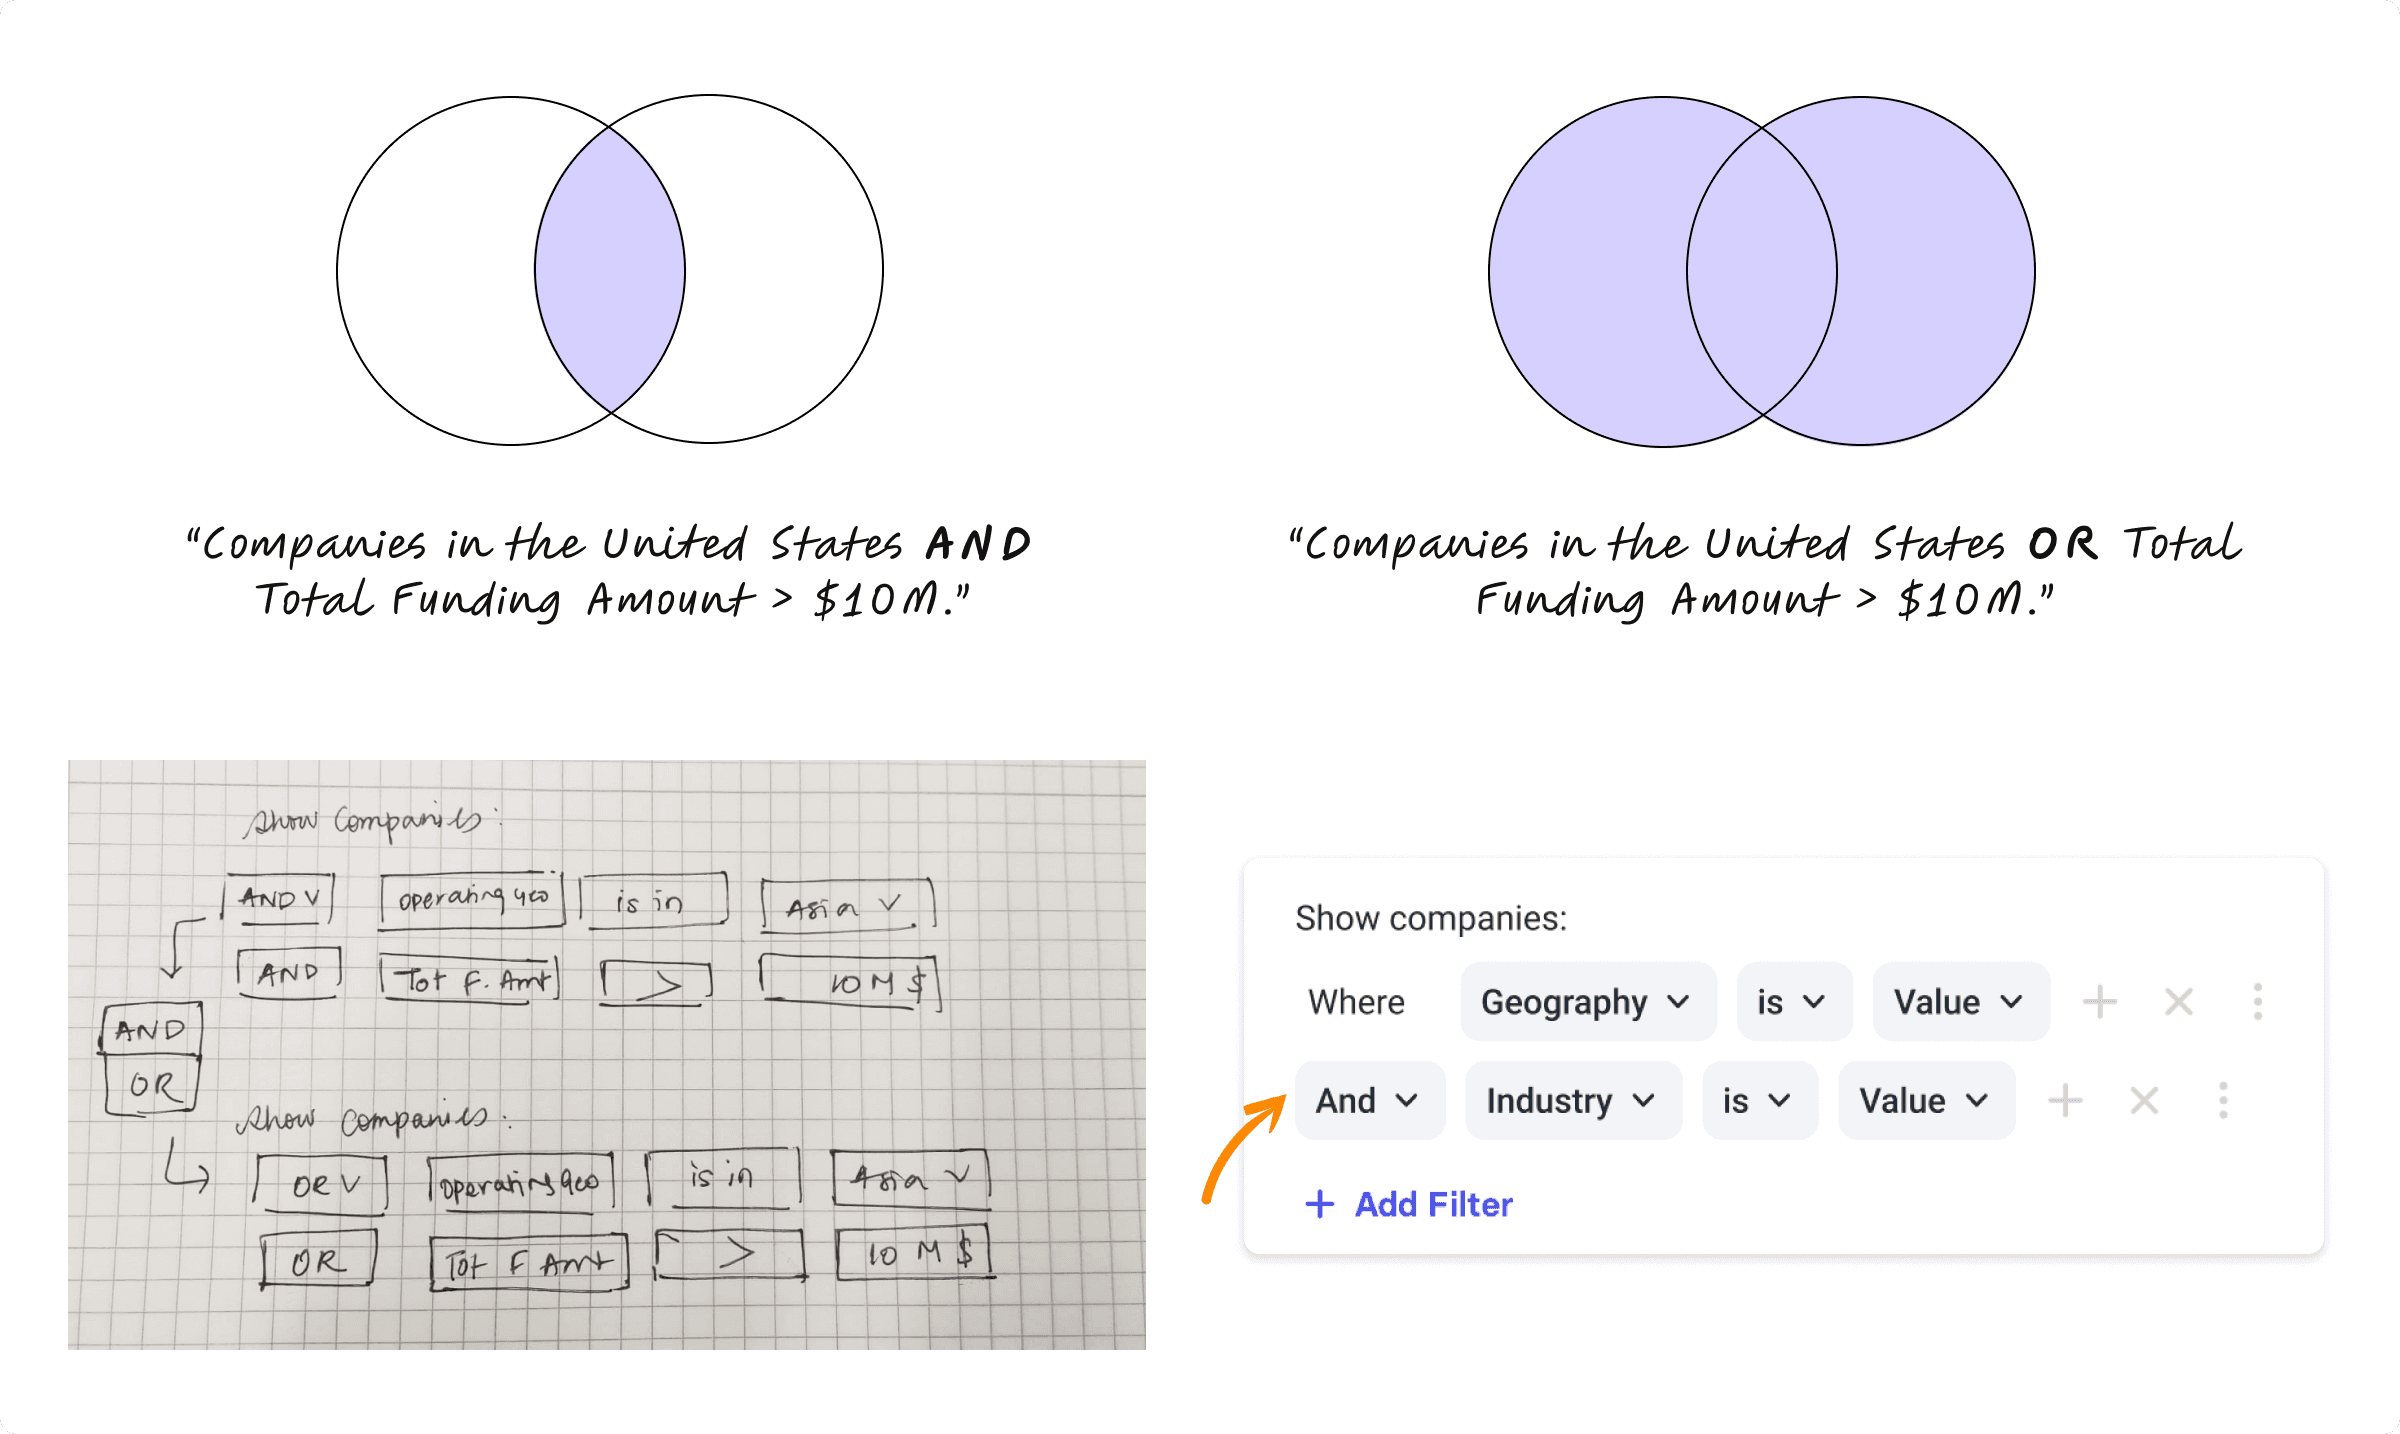
During team discussions, we realized using only AND logic was too restrictive for the type of company data analysts want.
While AND logic shows companies matching all criteria, analysts may also want to explore companies that match any condition—requiring OR logic. Following is an illustration of AND vs OR logic.
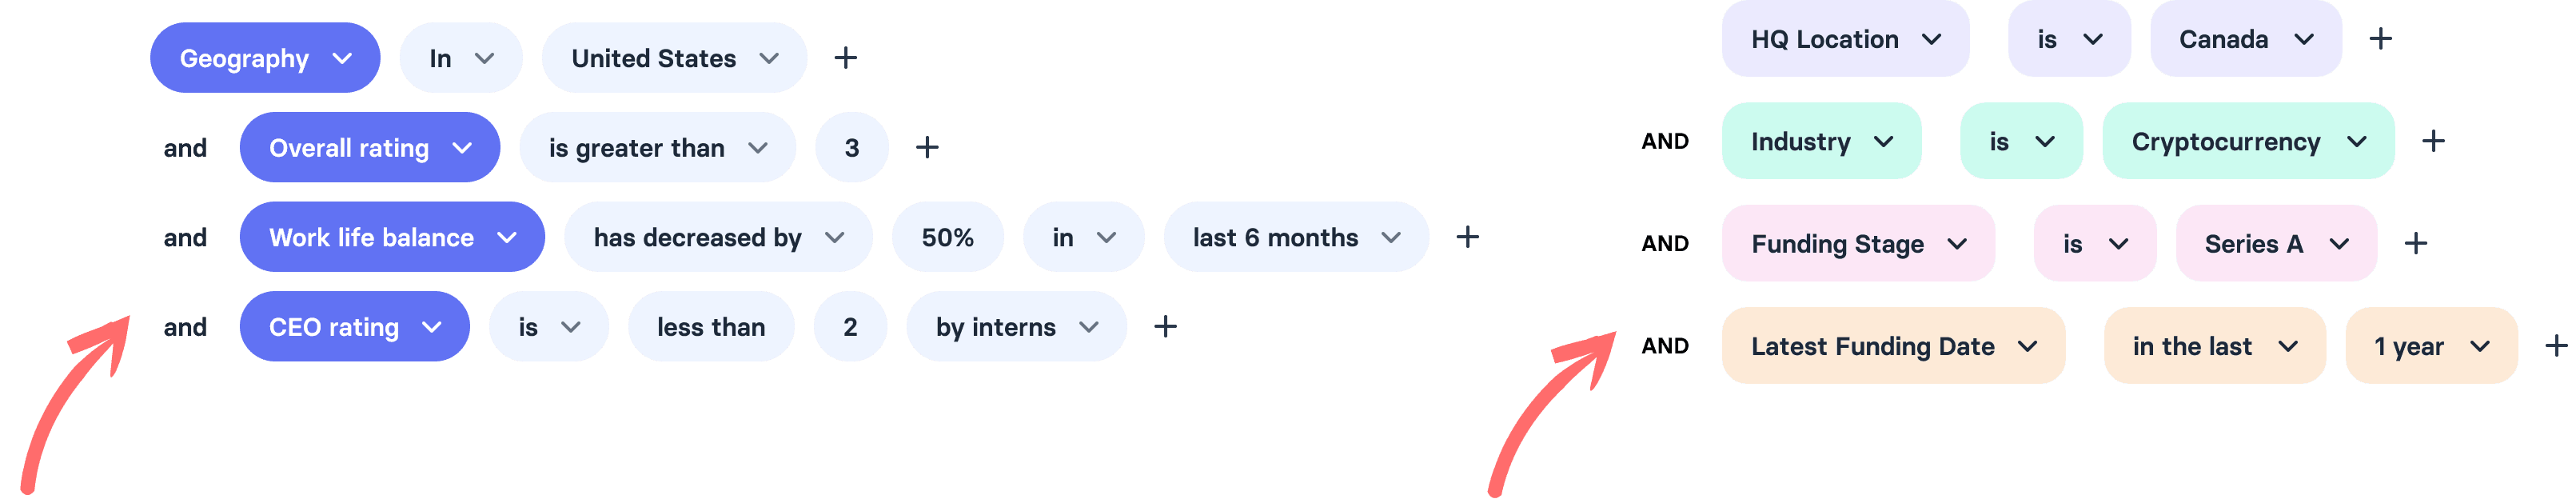
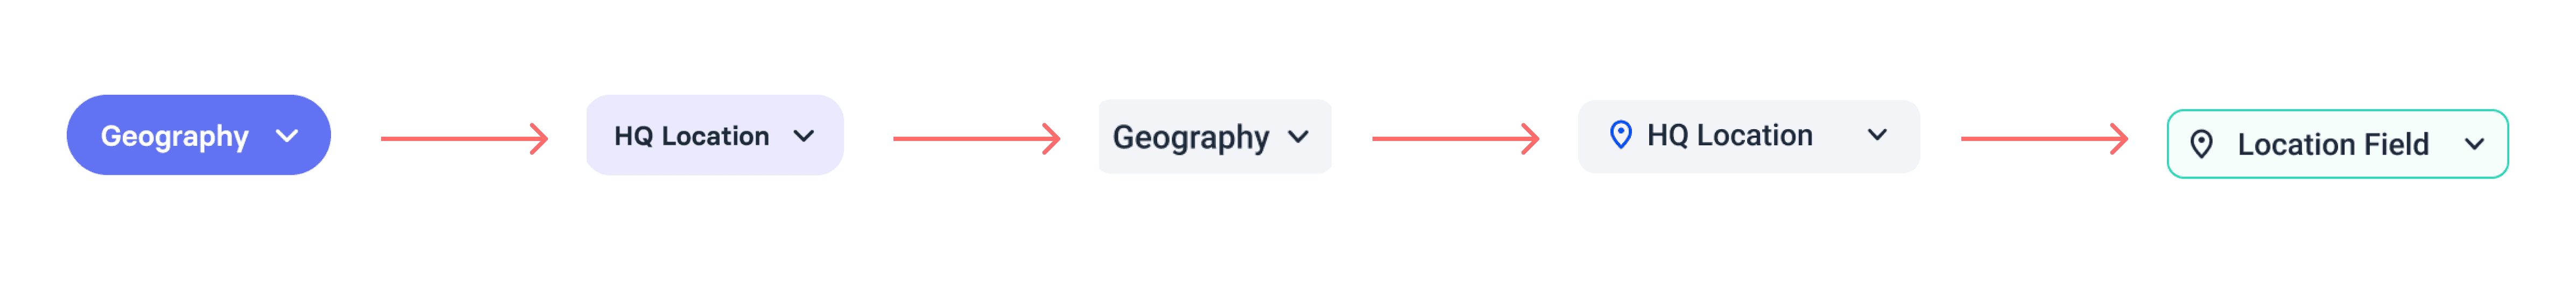
Evolution of filter dropdown design through the iterations
The filter evolved through iterations, starting with a brute force approach, progressing to functional testing, and incorporating icons to represent data types. We ultimately chose a lighter inner share with a strong background to embody the futuristic feel of the new design system.
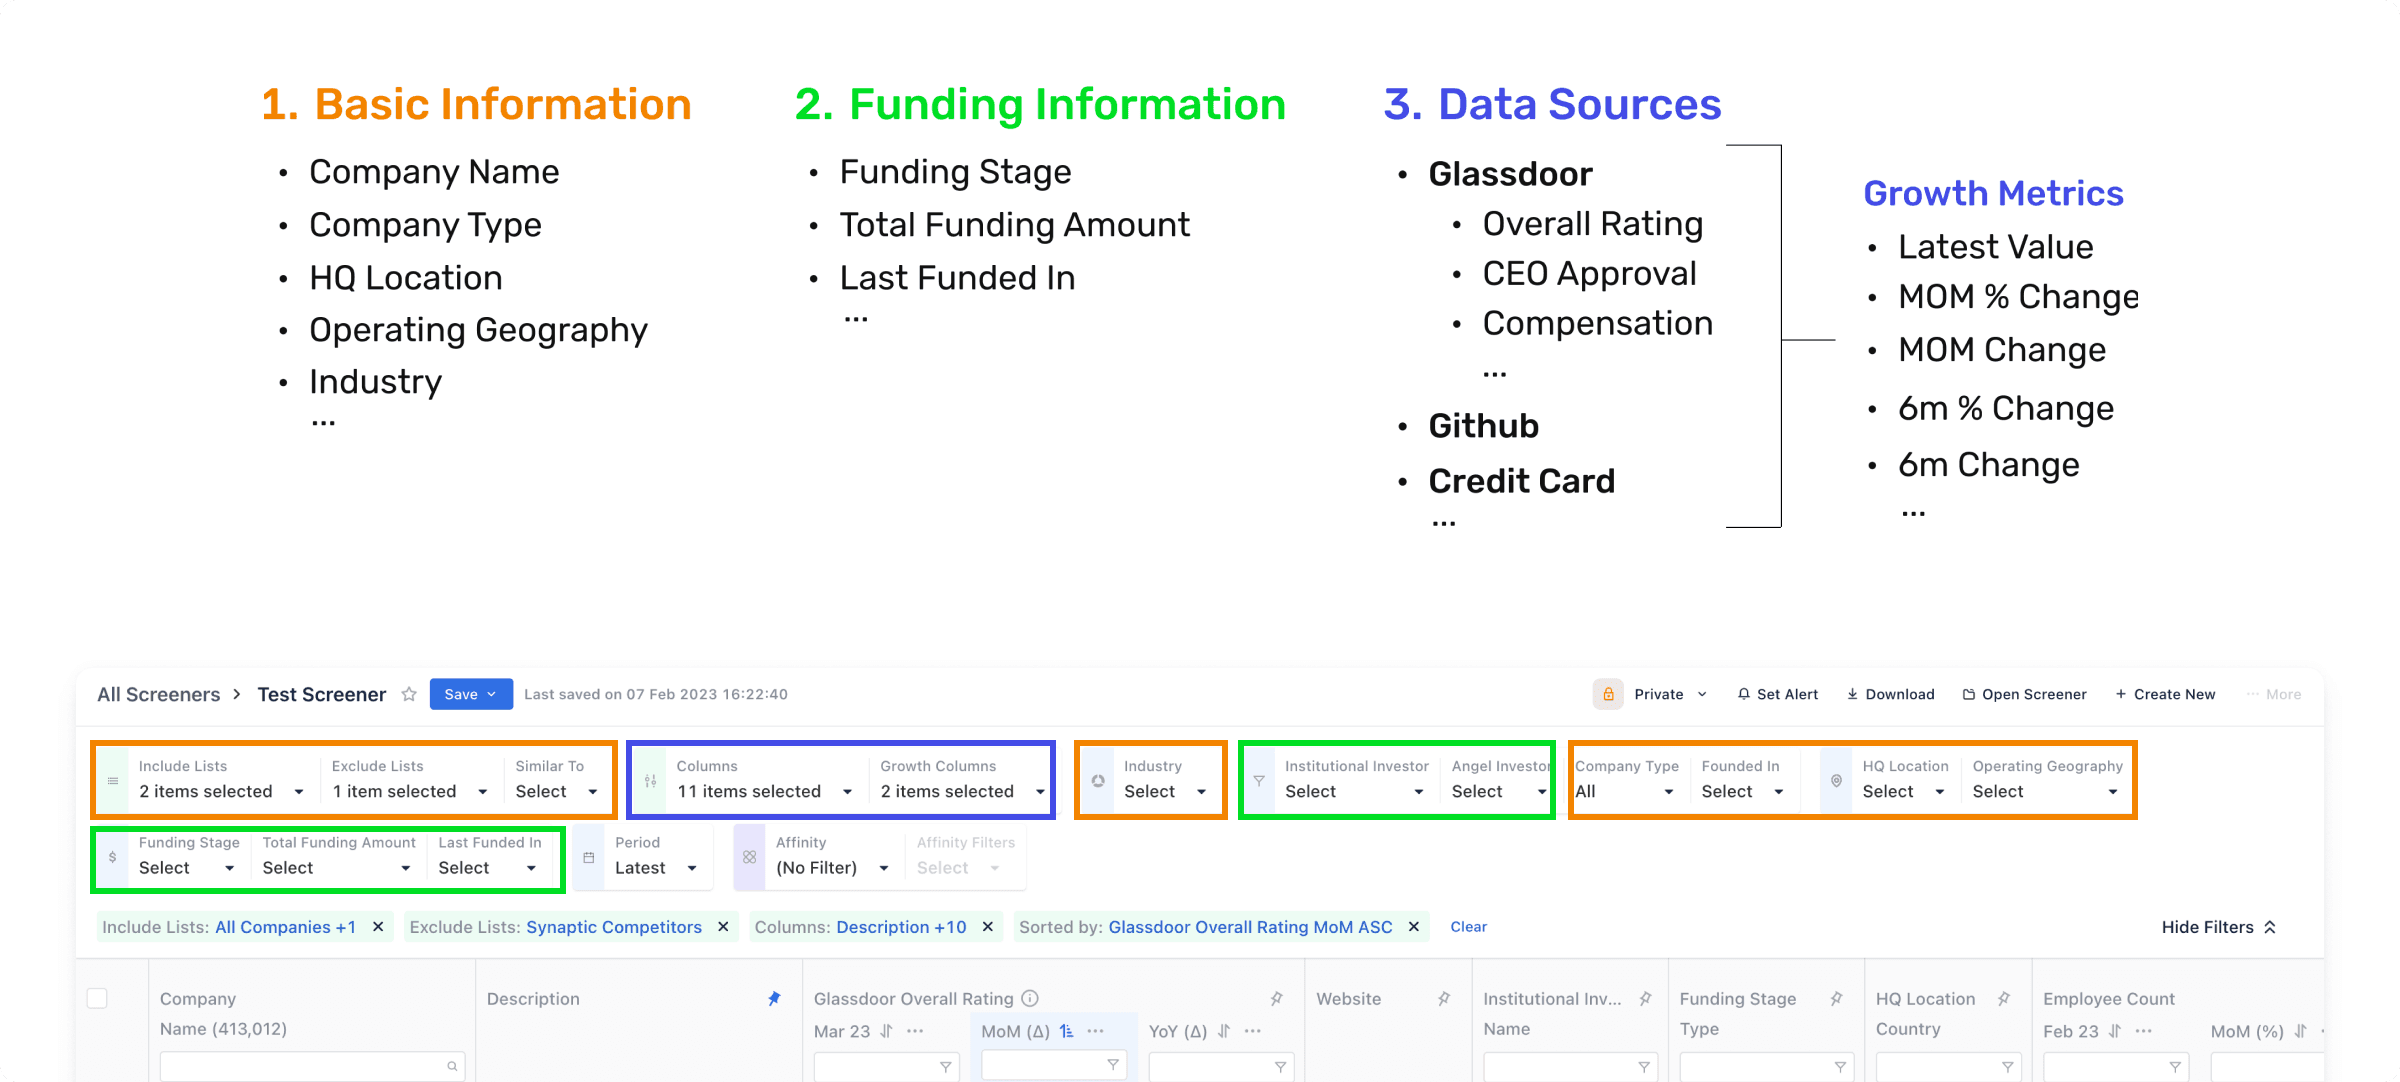
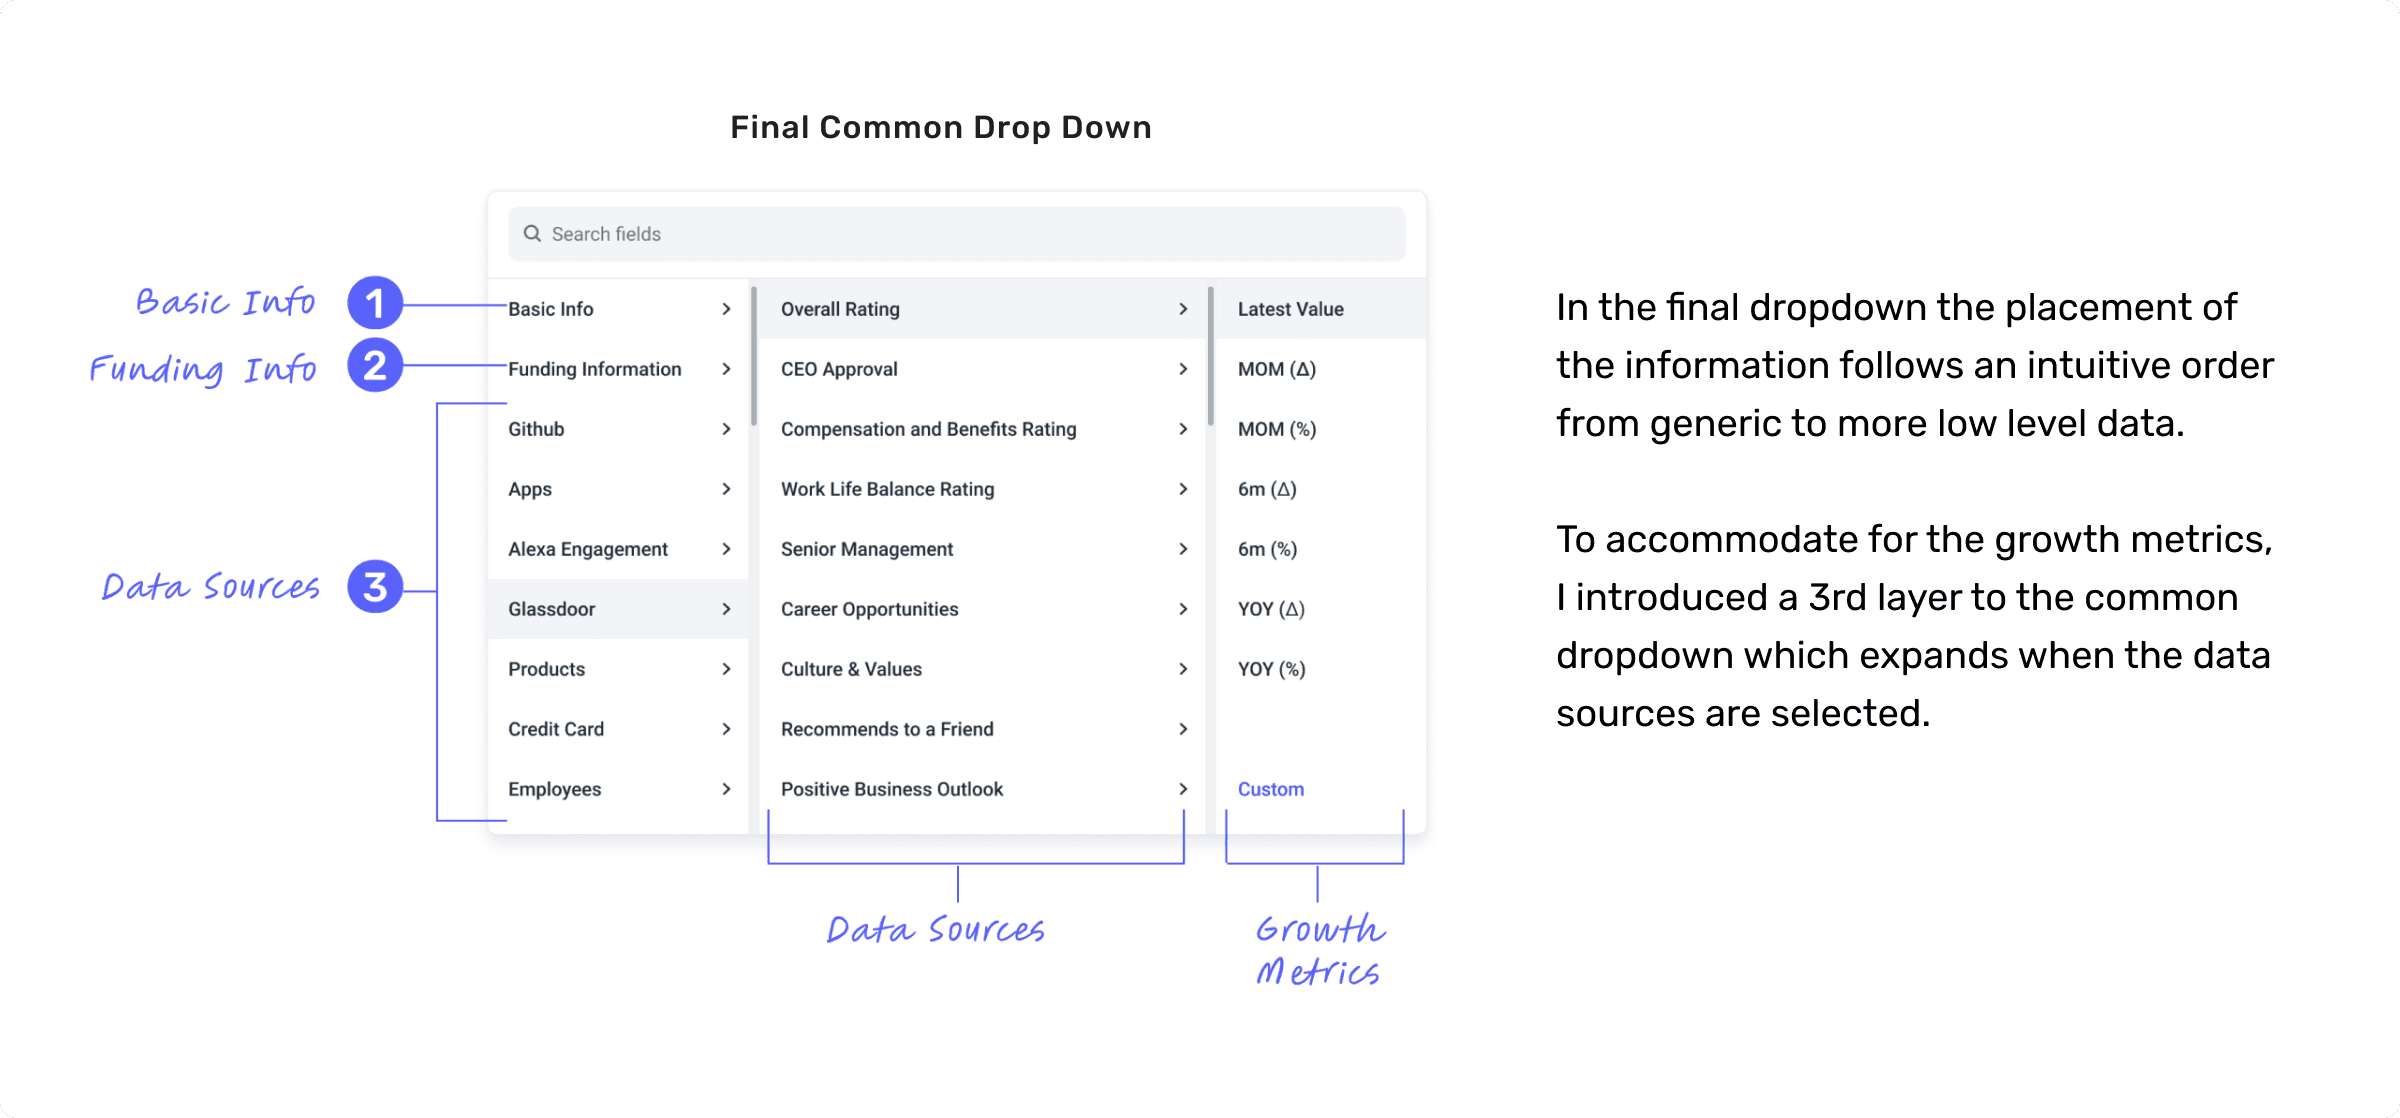
Creating the Common Drop Down
To design this I collaborated closely with the product manager to categorize filtering criteria into three main groups: Basic Information, Funding Information, and Data Sources. Following the same intuitive order from generic to more low level data in the final design.